AI Anomaly Detection for Business Data: Catch Spikes Before Monday
CEOs, ops leads, and finance leads still discover revenue drops, cost spikes, or funnel breaks days late in a Monday report. AI anomaly detection and outlier detection watch your KPIs continuously and surface abnormal moves in real time so someone investigates immediately, not after the damage is already in the pack.
We build the AI monitoring layer that alerts on outliers, not last week's chart.
Sound Familiar?
These are the exact issues our clients faced before AI monitoring:
- Revenue drops, cost spikes, or funnel breaks only surface in the Monday board pack, days after the damage started
- Ops and finance burn hours every week scrolling dashboards for outliers nobody has flagged
- Static threshold alerts fire on every seasonal bump, so the team mutes them and misses the real ones
- Fraud, payment failures, or checkout outages run for a weekend before anyone notices the metric moved
- BI tools show charts, but nobody is watching them in real time when a KPI leaves its normal band
Power BI, Tableau Pulse, and other BI suites now ship native anomaly modules, which raises the board expectation that someone is watching KPIs in real time. Chart-only packs without AI monitoring look late the moment a competitor catches the same outlier hours earlier.
What Anomaly Detection Actually Does
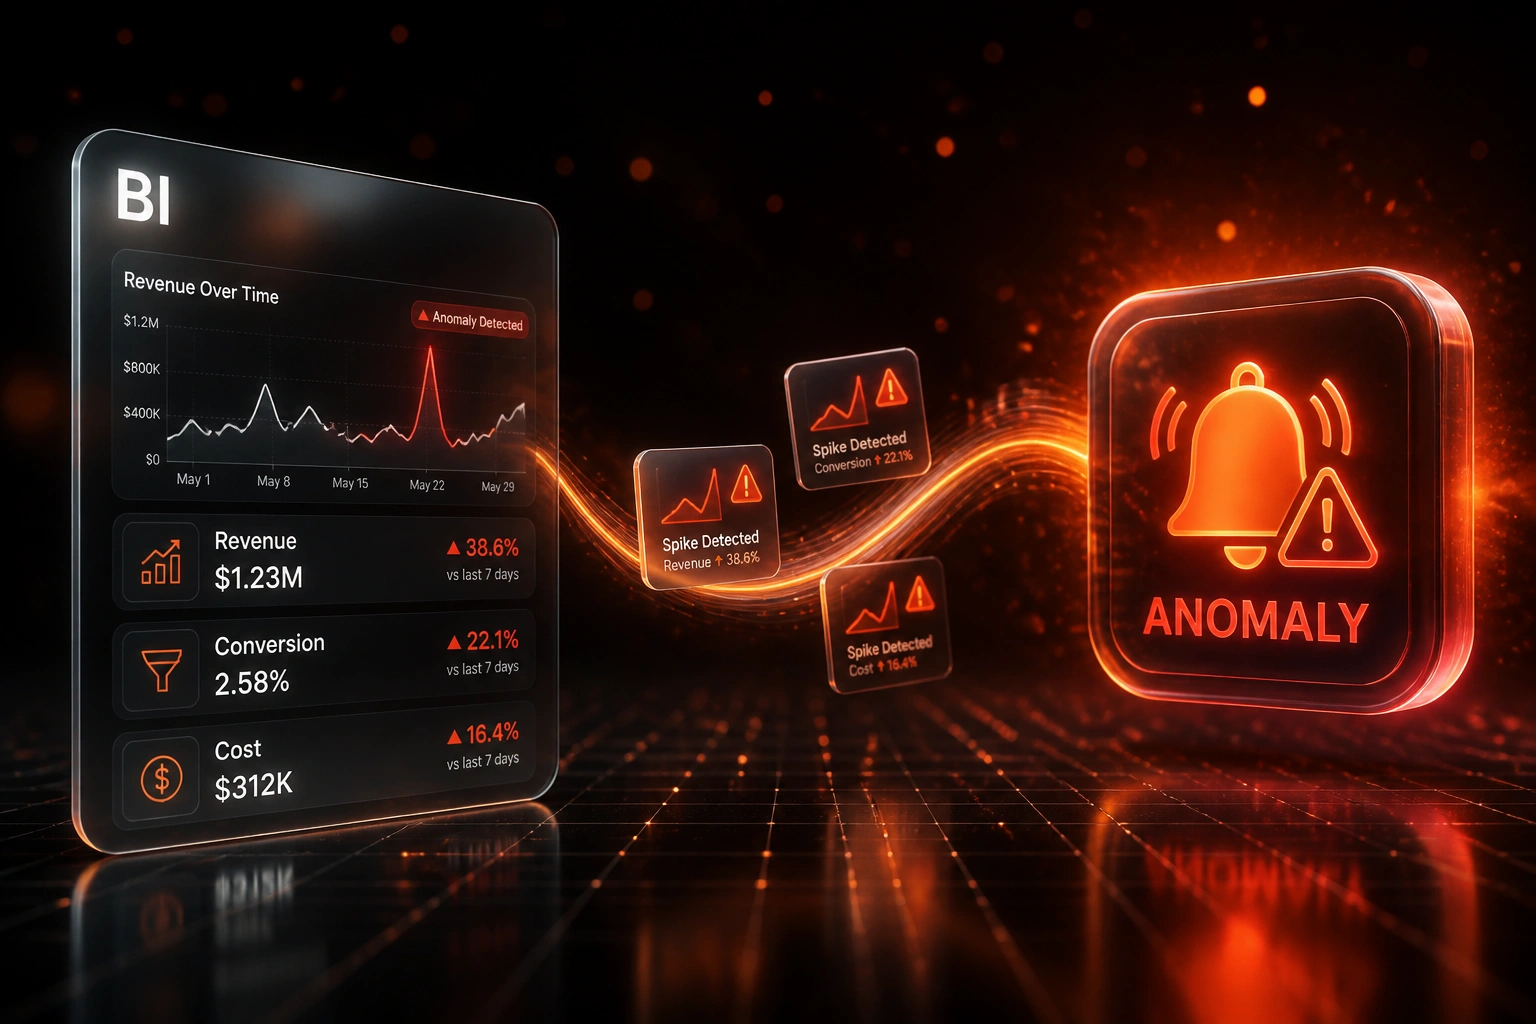
Metric moves abnormally → alert fires → owner investigates → outcome logged. No waiting for Monday.
KPI Leaves Its Band
Revenue, cost, conversion, or ops metric spikes or drops outside the learned baseline
Outlier Alert Fires
Severity-routed Slack, Teams, or email with expected range and contributing context
Owner Investigates
Ops or finance opens the annotated metric in BI or CRM and starts the runbook
Leakage Contained
Outage, fraud, or funnel break is caught in minutes instead of days later in a report
Everything You Need for Reliable AI Monitoring
KPI Baseline Learning
Models learn normal patterns by hour, day, and season for revenue, cost, conversion, and ops metrics, so a Tuesday spike is judged against Tuesday norms, not a flat line.
Real-Time Outlier Alerts
When a metric leaves its expected band, anomaly detection pushes Slack, Teams, email, or WhatsApp to the named owner within minutes, not after the next dashboard review.
Spike & Drop Context
Each alert carries the metric, expected range, deviation size, and contributing dimensions so ops and finance start investigating, not guessing which chart to open.
False-Positive Controls
Seasonality, known campaigns, and deploy windows suppress noise. Teams stop drowning in threshold chatter and start trusting AI monitoring signals.
CRM & BI Write-Back
Flags land in HubSpot, Salesforce, Power BI, or Looker as investigation tasks and annotated markers, so the outlier stays visible beside the live number.
Severity Routing
Minor drifts go to analysts; material revenue or cost outliers escalate to the CEO, ops lead, or CFO with a clear severity band and runbook link.
Sources We've Wired for Anomaly Detection
From 4-Day Detection Lag to Under 15 Minutes
How a 45-person ecommerce operator stopped discovering checkout and cost breaks in the Monday pack.
The Manual Watch
- Ops lead spent ~90 minutes a day scanning Power BI tiles for anything that "looked off"
- A Saturday checkout outage only surfaced in Monday's revenue pack
- Static cost alerts fired on every promo week, so the channel was muted
- Finance discovered a payment-failure spike three days late
- Board asked why nobody saw the drop while it was happening
Real-Time Outlier Detection
- Baselines on revenue, conversion, gateway failure rate, and paid media cost
- Severity-routed Slack alerts with expected range and dimension context
- Promo and deploy windows suppressed so the team trusts the signal
- Checkout and gateway breaks flagged within minutes, nights and weekends included
- Investigation tasks written back to HubSpot for ops ownership
Before vs After Anomaly Detection
How It Works
From first conversation to live outlier alerts in 3–6 weeks.
Tell Us Your KPIs
Which metrics matter, where they live, and which spikes or drops have already cost you money or sleep.
Free Scoping Call
30-minute call with your CEO, ops, or finance lead to pick alert owners, severity bands, and data sources.
Build & Shadow
We train baselines on your history, wire alerts, and run a shadow week so you compare machine flags to gut feel.
Go Live & Tune
Switch on real-time outlier detection. We tune sensitivity and routing until noise is low and trust is high.
Frequently Asked Questions
How is AI anomaly detection different from dashboard alerts?
Most dashboard alerts fire on fixed thresholds you set once and forget. AI anomaly detection and outlier detection learn what normal looks like for each KPI by time of day and season, then flag only material deviations. The point is real-time AI monitoring that wakes the right person when a metric behaves abnormally, not another tile that turns red every Black Friday.
How is this different from AI report generation or churn prediction?
Report generation summarises history into board prose after the period closes. Churn prediction scores which customers may leave. Anomaly detection watches live KPIs and surfaces spikes or drops the moment they leave the expected band, so ops and finance investigate immediately rather than discovering the break in next week's pack.
Will we get flooded with false alarms?
That is the failure mode of static rules. Peer-reviewed monitoring work shows threshold baselines near a 34% false-positive rate versus about 5% once ML baselines stabilise, with large cuts in daily alert volume. We tune sensitivity, suppress known events, and route by severity so your team trusts the signal.
What data sources can feed AI monitoring?
We typically watch revenue and orders from Stripe, PayFast, or your ecommerce platform; pipeline and conversion from HubSpot or Salesforce; costs and cash from Xero or Sage; and ops KPIs already in Power BI, Looker, Tableau, or a warehouse. If the metric already lands somewhere governed, we can monitor it.
How long does an anomaly detection project take?
Most builds take 3–6 weeks from scoping to go-live: KPI selection, baseline training, alert routing, and a parallel shadow week. A focused set of five to ten revenue and cost metrics on clean warehouse feeds can be live closer to two weeks.
How much does AI anomaly detection cost?
Focused KPI monitoring with real-time alerts typically starts from around R45,000. Broader builds covering multi-source metrics, severity routing, and CRM or BI write-back usually fall between R55,000 and R95,000. Teams that have already lost six figures to a late-discovered outage or fraud window usually recover the build within one or two quarters from leakage avoided and hours no longer spent hunting dashboards.
Stop Discovering Breaks in Monday's Pack
If revenue, cost, or funnel outliers still wait for a weekly review, you are paying for detection lag in leakage, fraud exposure, and lost hours.
Tell us which metrics matter, where they live, and which spike or drop already hurt. We will show you how AI anomaly detection would route the next outlier to the right person in minutes.