AI Inventory Optimisation: Balance Stock Levels with Demand Prediction
Guesswork reorder points leave ops directors with the same trap every month: dead stock ties up cash, or stockouts lose the sale. Inventory AI that factors seasonality and lead times recommends optimal stock levels and reorder points so you free working capital and cut lost-sales events.
We build the supply chain AI that writes replenishment recommendations into your ERP and WMS.
Sound Familiar?
These are the exact issues our clients faced before inventory AI:
- Reorder points sit in the ERP as static numbers someone guessed years ago, so dead stock and stockouts happen on the same SKU list
- Carrying cost quietly burns 20–30% of inventory value every year while cash stays locked on the shelf
- Planners raise safety stock after every scare, and buffers never come back down even when demand settles
- Purchase orders chase last month's sales instead of lead-time-aware demand, so overstock and lost sales trade places by season
- Ops and finance argue about working capital while WMS and ERP still recommend the same blanket min/max rules
Global out-of-stocks alone cost about R22 trillion in 2023 (IHL Group: $1.2 trillion at ~R18.5/USD), with overstocks adding another R10 trillion. Roughly four in ten stockout encounters lose the sale outright. Static ERP reorder points keep funding both sides of that distortion.
What Inventory AI Actually Does for Stock Optimisation
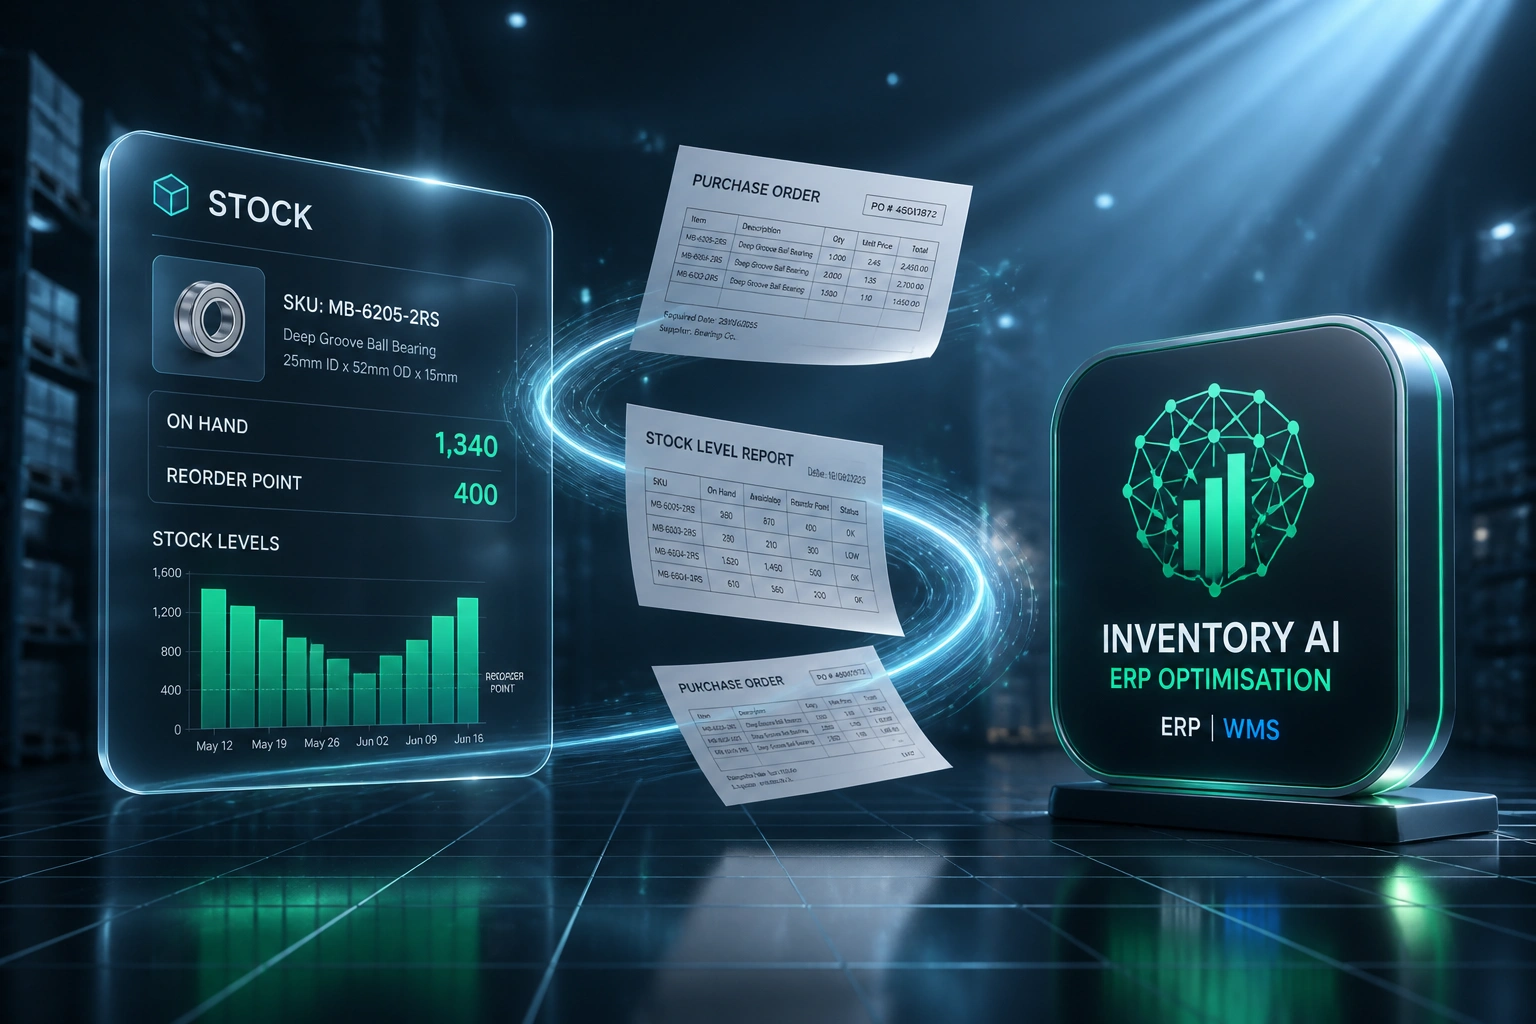
Sales and lead times in → demand prediction → optimal stock levels and reorder points in ERP/WMS.
History & Lead Times Load
Sales, on-hand, seasonality, and supplier lead times feed from ERP and WMS
Demand Model Runs
Patterns and external factors shape SKU demand prediction for the planning horizon
Stock Targets Update
Optimal stock levels, safety stock, and reorder points write into planning fields
Replenishment Follows
Purchasing acts on suggested POs; exceptions surface only where human judgment is needed
Everything You Need for Reorder Automation That Protects Cash
Demand-Aware Stock Targets
AI models read sales patterns, seasonality, and lead times, then recommend optimal stock levels per SKU instead of one-size min/max rules.
Dynamic Reorder Points
Reorder points and order quantities update as demand volatility and supplier lead times change, so replenishment stops guessing.
Safety Stock Optimisation
Probabilistic buffers replace rule-of-thumb weeks of cover. You hold less dormant capital without sacrificing fill rate.
ERP & WMS Write-Back
Recommended stock levels, reorder points, and suggested POs land in the planning fields your team already opens in Sage, SAP, NetSuite, or your WMS.
Overstock vs Stockout Trade-Off
The model weighs carrying cost against lost-sales risk so A-movers stay available and slow movers stop bloating the warehouse.
Replenishment Exception Alerts
When actuals drift from the band, purchasing gets a ranked list of SKUs to expedite, delay, or cut, not another spreadsheet rebuild.
Systems We've Connected for Inventory AI
From Static Reorder Points to R4.1M Freed
How a Cape Town wholesale distributor cut average inventory 22%, trimmed safety stock 30%, and cut stockout events 40% without dropping fill rate.
The Guesswork Buffer
- Reorder points were static min/max rules copied into Sage years earlier
- Average inventory sat near R18.5M, with carrying cost around 25% of value
- Safety stock grew after every scare and never reset when demand settled
- A-movers stocked out in peak weeks while slow movers filled the racks
- Purchasing spent Mondays rebuilding suggested orders from last month's sales
The Balanced Policy
- Demand prediction and inventory AI refresh stock levels and reorder points weekly
- Recommendations write into Sage planning fields and WMS replenishment queues
- Average inventory fell about 22%, freeing R4.1M in working capital
- Safety stock down ~30% on the pilot categories while fill rate held above 97%
- Stockout events on tracked A-movers fell about 40% over two peak cycles
Before vs After Inventory AI
How It Works
From first conversation to live stock recommendations in 5–8 weeks.
Tell Us Your Setup
Which ERP or WMS holds stock, how reorder points are set today, and where dead stock or stockouts hurt most.
Free Scoping Call
30-minute call with your ops or supply-chain lead to define SKU scope, service-level targets, and write-back fields.
Build & Shadow
We train demand and inventory models on your history, propose stock levels and reorder points, and shadow live replenishment for accuracy.
Go Live & Monitor
Recommendations write into ERP/WMS. Dashboards track turns, fill rate, carrying cost, and stockout events.
Frequently Asked Questions
How is inventory AI different from demand forecasting alone?
Demand forecasting predicts units you will sell. Inventory AI turns that forecast into stock levels, safety stock, and reorder points that balance carrying cost against stockout risk, then writes replenishment recommendations into your ERP or WMS. Forecast accuracy matters, but the commercial outcome is freer working capital and fewer lost-sales events.
What data do we need for stock optimisation?
We usually start with 12–24 months of sales and inventory movements by SKU, current reorder points or min/max rules, supplier lead times, and carrying-cost assumptions. Promo calendars and seasonality tags improve the model. Thin history still works with simpler policies; we expand features as volume grows.
Will this cut stock so far that we start missing orders?
No. Targets are set against agreed service levels (for example fill rate on A-movers). The model trims buffers where demand is stable and protects cover where lead times or volatility are high. We shadow recommendations against live orders before switching off manual overrides.
Which systems can receive the recommendations?
We have written stock levels, reorder points, and suggested purchase quantities into SAP, NetSuite, Sage, Microsoft Dynamics, Odoo, Syspro, and custom ERP/WMS platforms. If purchasing already works from planning fields in those systems, that is where the recommendations land.
How long does an AI inventory optimisation project take?
Most builds take 5–8 weeks from scoping to go-live: data audit, demand and inventory modelling, ERP/WMS field mapping, exception alerts, and a parallel shadow cycle on replenishment. Cleaner SKU histories with clear lead times can be live in about four weeks.
How much does AI inventory optimisation cost?
Custom inventory AI with ERP or WMS write-back typically ranges from R65,000 to R140,000 depending on SKU count, data sources, and platforms. Teams carrying seven-figure inventory usually recover the build within 2–4 months from lower carrying cost, freed working capital, and fewer stockout losses alone.
Stop Funding Dead Stock and Stockouts at the Same Time
If reorder points still reflect last year's gut feel, you are paying carrying cost on slow movers and losing sales on A-movers. Inventory AI already solves that trade-off.
Tell us which ERP or WMS holds your stock, how safety stock is set today, and where overstock or stockouts hurt most. We'll show you how demand prediction would drive optimal stock levels and reorder automation for your catalogue.