Billable vs Non-Billable Time Tracking: See Where Hours Really Go
You suspect utilisation is soft. You cannot prove whether hours disappeared into client delivery, internal meetings, rework, or admin. Without separating billable from non-billable time, every profitability conversation is guesswork.
We build the tracking that makes true utilisation visible every week.
Sound Familiar?
These are the exact issues managing partners and finance leads bring us:
- Partners sense utilisation is soft, but every dashboard only says "busy"
- Internal meetings, rework, and admin sit in the same bucket as client work
- Utilisation is debated once a year with incomplete timesheets and gut feel
- Finance cannot tell which hours generate revenue versus which hours only burn cost
- Pricing and hiring decisions rest on guesswork because the billable split is invisible
The urgency trigger is year-end. Partners discover low utilisation only when the annual review lands, months after non billable hours have already soaked capacity. Industry utilisation fell to a record-low 66.4% in 2025 while high-maturity firms still clear 80%+. Waiting another year to see the split is the most expensive reporting cycle you run.
What Billable vs Non-Billable Tracking Actually Does
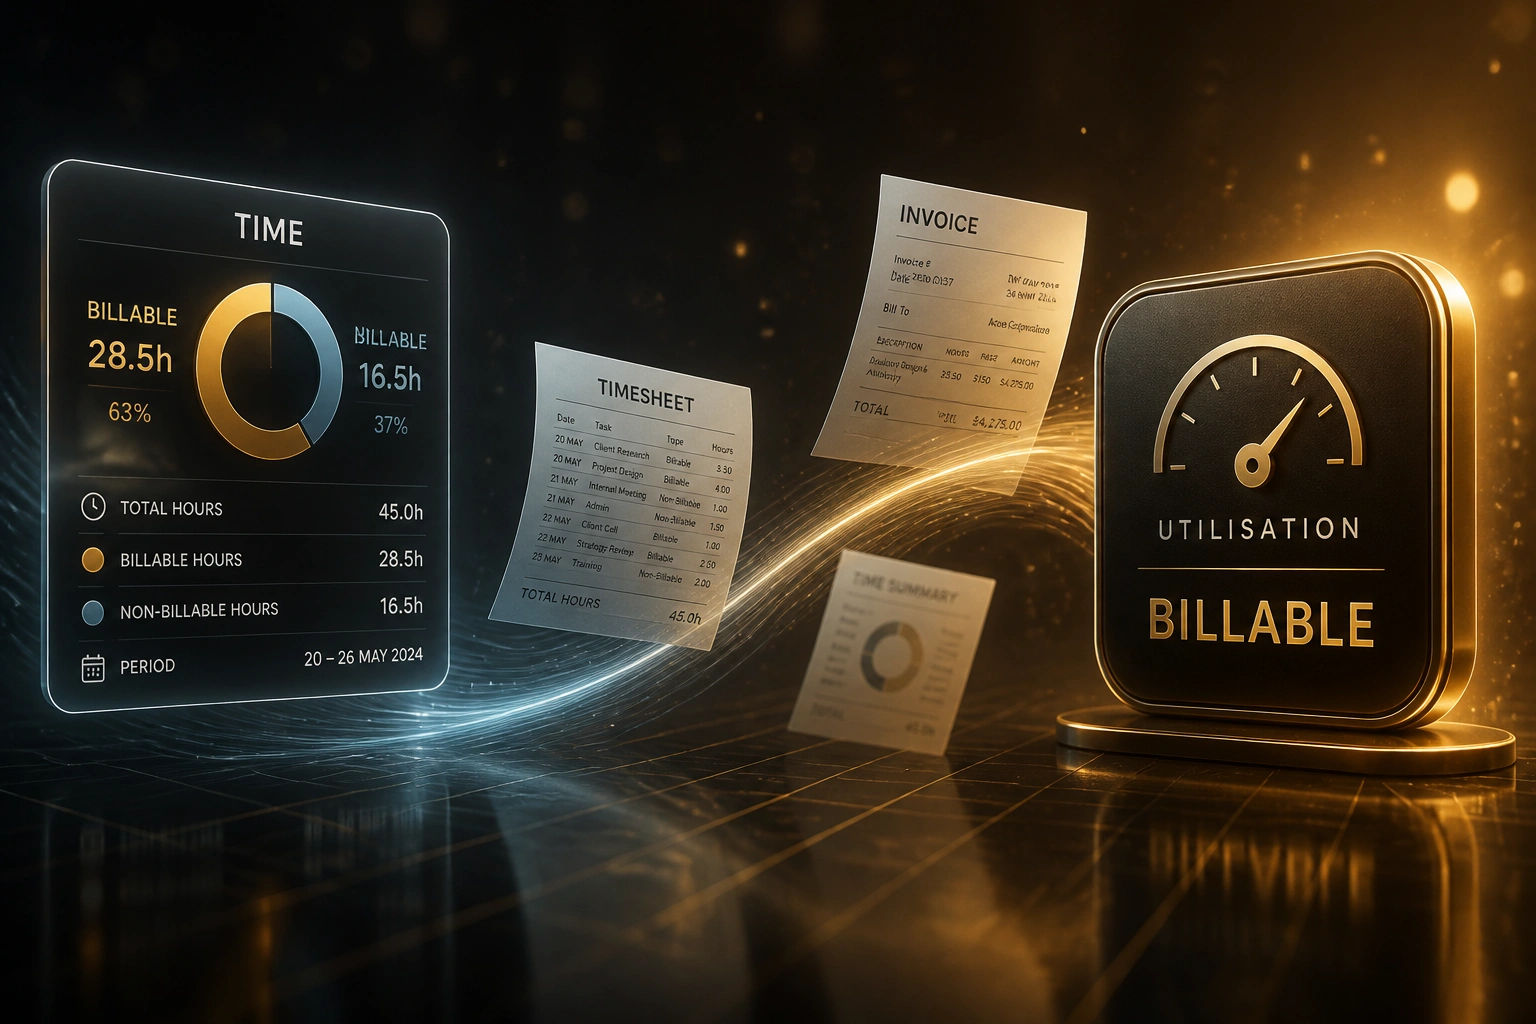
Hours logged → classified → utilisation updated → leakage flagged. Partners see the split while there is still time to act.
Hours Are Logged
Consultants capture time against projects with light-touch timers or calendar prompts
Hours Are Classified
Each entry maps to billable delivery or a non-billable category: meetings, rework, admin, BD
Utilisation Updates
Weekly dashboards show utilisation rate tracking by person, grade, and team
Leakage Is Flagged
Non-billable spikes and billable-but-unbilled hours surface before month-end write-downs
Everything You Need for Utilisation Rate Tracking
Billable vs Non-Billable Split
Every hour lands in a clear category: client delivery, internal meetings, rework, business development, or admin. Utilisation stops being a blended average.
Weekly Utilisation Dashboards
Partners and finance leads see utilisation rate tracking by person, grade, and team every week, not only when the year-end pack arrives.
Non-Billable Leakage Alerts
When non billable hours spike above agreed thresholds, managers get a flag before the month closes and the margin story is already written.
Realisation Cross-Check
Logged billable hours compare to hours actually invoiced, so misclassified time and silent write-downs surface while the engagement is still live.
Category Rules and Approvals
Clear coding rules and manager review stop staff dumping ambiguous hours into "general" and polluting the utilisation picture.
Project and Accounting Sync
Approved splits sync to your project tool and finance stack so capacity, payroll cost, and invoicing all share one truth.
Tools We've Connected for Utilisation Visibility
From Year-End Shock to Weekly Clarity
How an 18-person management consultancy moved from 64% to 72% utilisation once billable and non-billable hours were separated.
The Blended Picture
- Timesheets existed, but every hour sat in one undifferentiated bucket
- Partners assumed the team was fully loaded because calendars looked full
- Utilisation was only calculated for the annual partner review
- Year-end pack showed 64% billable against a 75% target
- Finance could not explain whether the gap was meetings, rework, or underpricing
The Separated Picture
- Every hour coded billable delivery or a named non-billable category
- Weekly partner dashboard showed utilisation by grade and team
- Internal meeting load and rework loops became visible cost centres
- Utilisation climbed to 72% within five months without hiring
- Realisation checks flagged billable hours that never reached an invoice
Before vs After Billable Separation
How It Works
From first conversation to live utilisation dashboards in 2–4 weeks.
Tell Us Your Setup
How hours are logged today, which tools you use, and where billable versus non-billable visibility breaks down.
Free Scoping Call
30-minute call to design category rules, utilisation targets by grade, and the partner dashboards finance needs.
Build & Test
We configure the split, connect project and billing tools, and run a parallel month so the numbers prove out.
Go Live & Monitor
Switch off year-end guesswork. Monitoring keeps coding discipline high and utilisation data trustworthy.
Frequently Asked Questions
How is billable time tracking different from a generic timesheet tool?
Most firms already log hours. The gap is classification. Billable time tracking separates revenue-generating client work from non billable hours (internal meetings, rework, admin, BD) so utilisation rate tracking reflects true capacity, not a blended "busy" number. Without that split, every profitability conversation is guesswork.
What utilisation rate should we target?
SPI Research treats roughly 75% billable utilisation as the industry ambition, while the 2025 professional services average fell to 66.4%, the lowest in that survey's history. High-maturity firms often clear 80%. Your target should still come from your own margin model, rates, and grade mix, not a single industry number.
Will this create more admin for consultants?
No. We keep capture light (timers, calendar prompts, mobile entry) and put the discipline into category defaults and manager review. Staff still log once; finance and partners finally see the split that matters.
How does this help realisation, not just utilisation?
Utilisation measures how much available time is billable. Realisation measures how much of that billable value actually invoices. We surface both: hours coded billable but never billed, and hours coded internal that should have been client work. Misclassified hours quietly destroy both metrics.
Which tools can you connect?
We regularly configure Harvest, Toggl Track, Clockify, Float, Monday.com, and custom trackers with HubSpot, Xero, Sage, and QuickBooks. If your stack exposes time entries, project codes, and rate cards, we can feed a clean billable versus non-billable view.
How much does billable vs non-billable tracking cost to set up?
Category rules and partner dashboards start from around R15,000. Full integrations with project tools, approvals, realisation checks, and accounting sync typically range from R25,000 to R60,000. Firms closing even part of an 8-point utilisation gap usually see payback within 2–3 months.
Stop Guessing at Utilisation
If partners only learn the true billable ratio at year-end, you are managing the firm with last year's damage report.
Tell us how hours are logged today, which tools you use, and where profitability debates go circular. We will show you exactly how billable versus non-billable separation would work for your practice.