Churn Prediction Model Implementation: Stop Revenue Loss Before It Starts
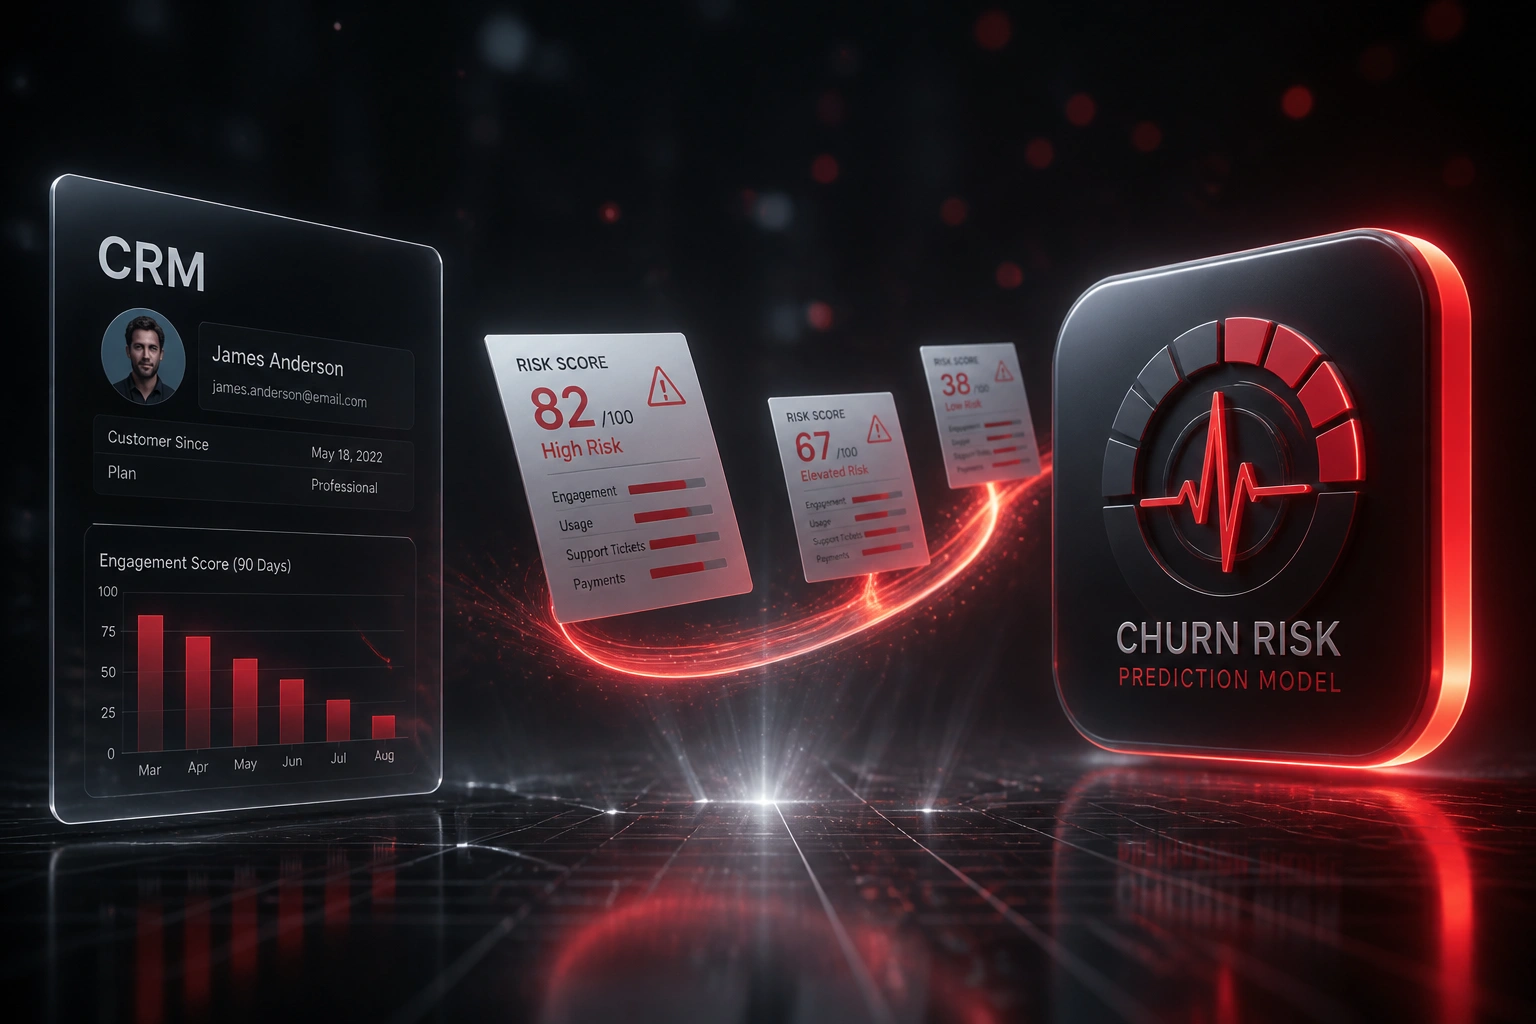
Most SaaS CEOs and CS directors know churn is expensive, yet they still wait for the cancellation email. Implement a churn prediction model that scores at-risk customers from engagement decline, failed or late payments, and support ticket spikes, and your team can intervene weeks earlier.
We plumb the data, train the model, write risk into the CRM, and go live with save playbooks.
Sound Familiar?
These are the exact issues our SaaS clients faced before a live churn prediction model:
- CS only learns about churn when the cancellation email arrives
- Engagement declines, failed payments, and ticket spikes live in three different tools
- Health scores are static rules nobody trusts, so save playbooks never fire
- Billing dunning recovers some cards but never tells CRM which accounts are about to leave
- Weekly stand-ups debate anecdotes instead of a ranked at-risk list with lead time
Net revenue retention sits near 101% median while new CAC ratios climb (Benchmarkit 2025). Billing dunning recovers some failed cards, but without a model that joins engagement, payments, and tickets into CRM, voluntary and silent churn still arrives as a board surprise.
What the Churn Prediction Model Actually Does
Engagement + payments + tickets score daily → CRM updates → CS runs the save playbook before the cancel request.
Signals Join Overnight
Product engagement, payment events, and support ticket frequency land in one feature store
Model Scores Risk
Predictive analytics ranks every account with a 0–100 score and top contributing drivers
CRM Write-Back
Risk band, score, and reasons update the account so CS sees at-risk customers in their queue
Save Playbook Fires
Tasks, alerts, and sequenced outreach start while there is still lead time to keep the logo
Everything You Need for Customer Retention Scoring
Engagement Feature Pipeline
Login frequency, feature adoption slope, and seat utilisation feed the model so declining product use shows up as risk weeks before cancellation.
Payment Pattern Signals
Failed renewals, late payments, retry loops, and card-age flags join the score. Repeat failures are treated as churn predictors, not just finance noise.
Support Ticket Frequency
Ticket volume shape, reopen rates, and billing or integration categories weight the model. Spike-and-silence patterns surface friction the CRM alone misses.
Unified Risk Score
One operational churn prediction model joins engagement, payment, and support into a daily 0–100 score with explainable top drivers for every account.
CRM Write-Back
Scores, risk bands, and trigger reasons land on HubSpot, Salesforce, Pipedrive, or Dynamics records so CS works from the CRM, not a spreadsheet export.
Save Playbook Automation
High-risk bands open tasks, Slack alerts, and sequenced outreach. Saved and lost outcomes retrain the model so predictive analytics stay calibrated.
Platforms We've Wired Into Churn Models
From Cancellation Surprises to 42-Day Lead Time
How an R18M ARR B2B SaaS team in Johannesburg implemented a churn prediction model and kept logos that were walking out the door.
Waiting for the Cancel Email
- CS directors saw churn as a monthly board slide after logos had already left
- Product usage lived in Mixpanel, payments in Stripe, tickets in Zendesk
- Failed-payment dunning recovered cards but never flagged accounts to CRM
- Average warning before a cancellation was about a week of gut feel
- Save attempts started after the customer had already decided
One Operational Model Live
- Engagement slope, payment failures, and ticket frequency scored nightly
- Risk bands wrote back to HubSpot with top drivers on every account
- High-risk playbooks opened CSM tasks and Slack alerts automatically
- Median lead time before a churn event stretched to 42 days
- CS worked a Monday ranked list instead of Friday cancellation emails
Before vs After Model Implementation
How It Works
From first conversation to a live churn prediction model in 4–8 weeks.
Tell Us Your Setup
Which CRM, billing, product analytics, and helpdesk you run, and where at-risk customers currently hide.
Free Scoping Call
30-minute call with your CEO or CS director to map data sources, risk bands, and save playbook owners.
Build & Test
We plumb engagement, payment, and ticket feeds, train the churn model, write scores to CRM, and shadow live for a week.
Go Live & Monitor
CS works the ranked list. We monitor save rates, lead time before churn events, and ARR retained.
Frequently Asked Questions
How is a churn prediction model implementation different from a health score?
Health scores are usually static rules: last login, open tickets, or NPS. A churn prediction model is trained on your historical cancellations and scores each account from joined engagement decline, payment patterns, and support ticket frequency. The output is a ranked early-warning list with lead time, not a traffic light nobody updates.
What data do we need to go live?
We typically need 12–24 months of logo churn and renewals, product engagement or seat data, billing events (failures, late payments, dunning outcomes), and support ticket history. Thin product analytics still work if CRM activity, payments, and tickets are clean; we expand features as instrumentation matures.
How is this different from AI churn prediction or exit reporting?
AI churn prediction pages sell the scoring idea. Exit reporting explains why customers already left. This engagement is the data plumbing and go-live of one operational model: join the three signal families, write risk back to CRM, and fire save playbooks so CS intervenes weeks earlier.
Will CSMs act on the scores?
Adoption fails when scores feel arbitrary. We ship top contributing signals on every account, calibrate bands against real churn rates, and wire playbooks so a high-risk flag becomes a task with an owner. A shadow week lets your CS director compare model flags to gut feel before cutover.
How long does implementation take?
Most churn prediction model implementations take 4–8 weeks from scoping to go-live: source audit, feature joins, model training, CRM write-back, playbook wiring, and a parallel shadow week. Cleaner HubSpot or Salesforce stacks with clear cancellation history can be live in about three weeks.
How much does a churn prediction model cost?
Implementations that join engagement, payments, and tickets with CRM write-back and save playbooks typically range from R55,000 to R120,000 depending on sources and platforms. Teams with meaningful ARR at risk usually recover the project cost within 2–4 months from logos saved and CSM hours redirected.
Implement Predictive Analytics Before the Next Logo Walks
If your CS team still learns about churn from cancellation emails, you are paying rising CAC to refill a leaky bucket while net revenue retention stays under pressure.
Tell us which CRM, billing, product analytics, and helpdesk you run. We will show how a churn prediction model that joins engagement, payment patterns, and ticket frequency would write risk into your CRM and fire save playbooks with real lead time.