Customer Churn Reporting: See Attrition Before They Cancel
Most CEOs and CS leads only notice customer attrition after the subscription is cancelled. By then the save window is closed, and you are paying five to ten times more to acquire a replacement than it would have cost to keep them.
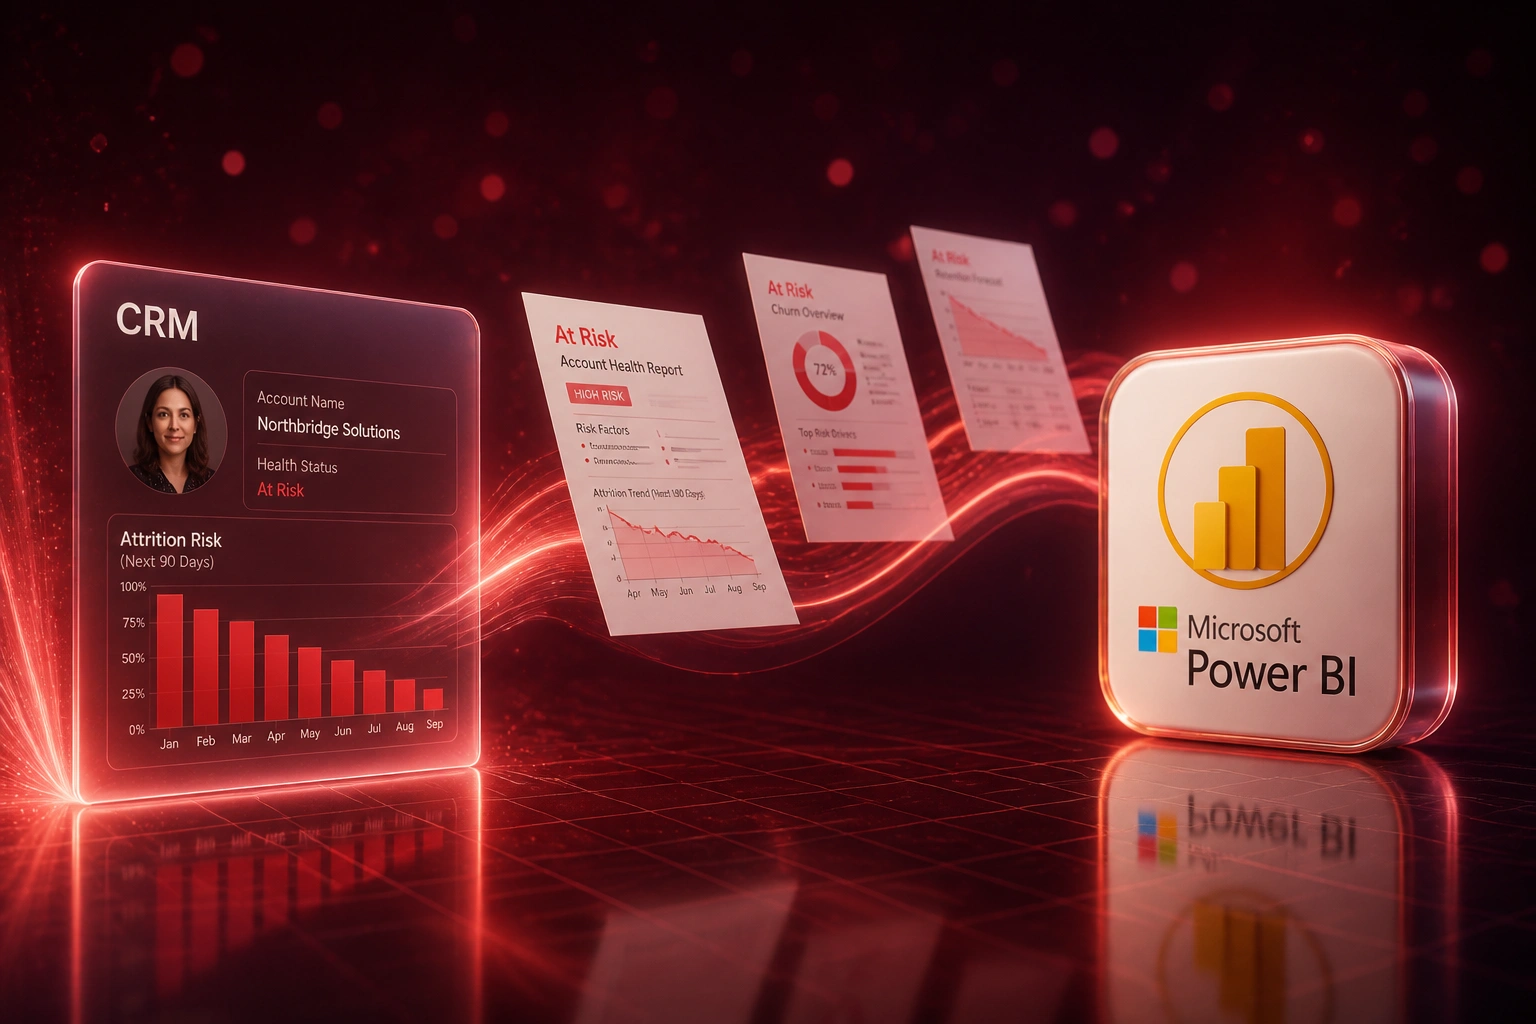
We build the churn reporting that joins CRM, billing, and support so at-risk accounts and exit patterns surface early enough to intervene.
Sound Familiar?
These are the exact issues our clients faced before churn reporting was joined across systems:
- You only learn a customer cancelled when finance spots a cancelled subscription or an unpaid invoice
- CS builds Friday churn lists by exporting HubSpot, Stripe or Chargebee, and Zendesk into one stale spreadsheet
- Support ticket spikes and usage drops never meet billing signals in the same view
- Exit surveys arrive after the contract is already dead, so common attrition patterns stay invisible
- Replacement acquisition spend climbs while preventable churn quietly drains ARR
Rising acquisition costs make retention the cheapest growth lever left. Stripe, Chargebee, and most subscription billing stacks show cancellations and unpaid invoices, but they do not natively join CRM champions, support escalations, and exit patterns into one retention analysis your CS team can act on in time.
What Customer Churn Reporting Actually Does
Signals fire → risk scores update → CS intervenes → exit patterns feed the next playbook.
Signals Arrive
Usage drop in CRM, unpaid or cancelled billing, or a spike in open support tickets
Risk Score Updates
Account lands on the at-risk list with the top drivers named, not a vague red flag
CS Intervenes
Owner gets an alert while there is still a 30–90 day window to save the account
Patterns Named
Churn reports show recurring exit reasons so playbooks improve, not just firefights
Everything You Need for Reliable Retention Analysis
At-Risk Account Alerts
CRM health, billing cancellations, unpaid invoices, and support escalations score into one risk list your CS lead can act on the same day.
Exit Pattern Analysis
Churn reports group why accounts leave: champion departure, unresolved tickets, failed payments, or stalled adoption, so prevention is specific.
CRM + Billing Join
Subscription cancelled, unpaid, and dunning events from Stripe, Chargebee, or Xero sync beside the CRM account that owns the relationship.
Support Signal Overlay
Ticket volume, age, and severity from Zendesk, Intercom, or Freshdesk land on the same account timeline as usage and billing risk.
Retention Cohort Views
Track customer attrition by segment, plan, and tenure so leadership sees where retention analysis actually moves NRR.
Board-Ready Churn Packs
Scheduled Power BI, Looker, or Metabase packs for CEOs and CS leads: logo churn, revenue churn, saves, and at-risk ARR in one trusted pack.
Platforms We've Joined for Churn Reporting
From Friday Spreadsheets to 45-Day Warning
How a subscription SaaS team cut monthly logo churn from 4.2% to 2.8% and protected R1.1M ARR in year one.
The Manual Process
- CS lead exported HubSpot accounts, Stripe cancellations, and Zendesk tickets every Friday
- 6 hours a week stitching a churn list that was already five days stale
- Most saves started within two weeks of cancel, when save rates collapse to 10–18%
- Leadership saw logo churn after month-end, never the exit patterns driving it
- Marketing spent roughly R41,000 CAC replacing accounts that looked healthy on the spreadsheet
The Joined Reporting Process
- CRM health, Stripe unpaid/cancelled, and ticket age score into one at-risk view daily
- CS reviews a ranked list in minutes instead of rebuilding exports
- Median warning window moved to about 45 days, inside the 35–45% save-rate band
- Exit-pattern reports named failed payments, champion loss, and unresolved P1 tickets as top drivers
- Board pack shows logo churn, revenue churn, and ARR at risk from the same source of truth
Before vs After Churn Reporting
How It Works
From first conversation to live churn reporting in 2–4 weeks.
Tell Us Your Stack
Which CRM, billing platform, and support tool you run, and how you currently spot at-risk accounts.
Free Scoping Call
30-minute call to map churn signals, exit reasons you already know, and the report your CEO actually wants.
Build & Validate
We join CRM, billing, and tickets into live churn reporting, then reconcile a parallel month against your old spreadsheet.
Go Live & Coach
Switch off Friday export theatre. Your CS lead gets alerts, exit-pattern views, and a short handoff on how to intervene.
Frequently Asked Questions
How long does customer churn reporting take to set up?
A focused CRM-plus-billing churn dashboard typically takes 2–4 weeks from scoping to go-live. Broader setups with support tickets, cohort attrition views, and board packs usually land in 4–6 weeks.
Which systems can feed the churn reports?
We commonly connect HubSpot, Salesforce, Pipedrive, Stripe, Chargebee, Xero, Zendesk, Intercom, Freshdesk, and Power BI or Looker. If the tool has an API or reliable export, we can bring the signal in.
Will this replace Gainsight or ChurnZero?
Not necessarily. Many clients need joined reporting and alerts without buying a full CS platform. If you already run Gainsight or similar, we can still feed cleaner CRM, billing, and support data into it, or sit a Power BI layer beside it for the board.
How do you define at-risk without drowning the team in false alarms?
We weight signals against your historical churn: sustained usage drop, unpaid or cancelled billing events, unresolved tickets, and champion changes. Thresholds are tuned in parallel testing so CS only sees accounts worth a call.
Can leadership still get a monthly attrition pack?
Yes. Most clients keep a scheduled Power BI or Looker pack covering logo churn, revenue churn, save rate, and common exit patterns, generated from the same joined data the live alerts use.
How much does churn reporting integration cost?
Straightforward one-way reporting feeds start from around R15,000. Multi-source churn reporting with risk scoring, exit-pattern analysis, and CRM write-back typically ranges from R25,000 to R60,000. Teams losing six figures of ARR to preventable churn usually recover the investment within one or two saved accounts.
Stop Discovering Churn After They Cancel
If your team still learns about attrition from a cancelled subscription or an unpaid invoice, you are intervening after the cheapest save window has closed.
Tell us which CRM, billing platform, and support tool you run, and how you currently build the churn list. We will show you exactly how joined churn reporting would surface at-risk accounts and exit patterns for your business.