Customer Lifetime Value Reporting: Stop Funding Low-Value Cohorts
You are pouring acquisition budget into channels that look cheap on CPA while the customers they bring barely repay the cost. Without CLV reporting, low-value segments keep winning budget and high-value cohorts stay underfunded.
We build the profitability view that shows which segments and channels deliver long-term value.
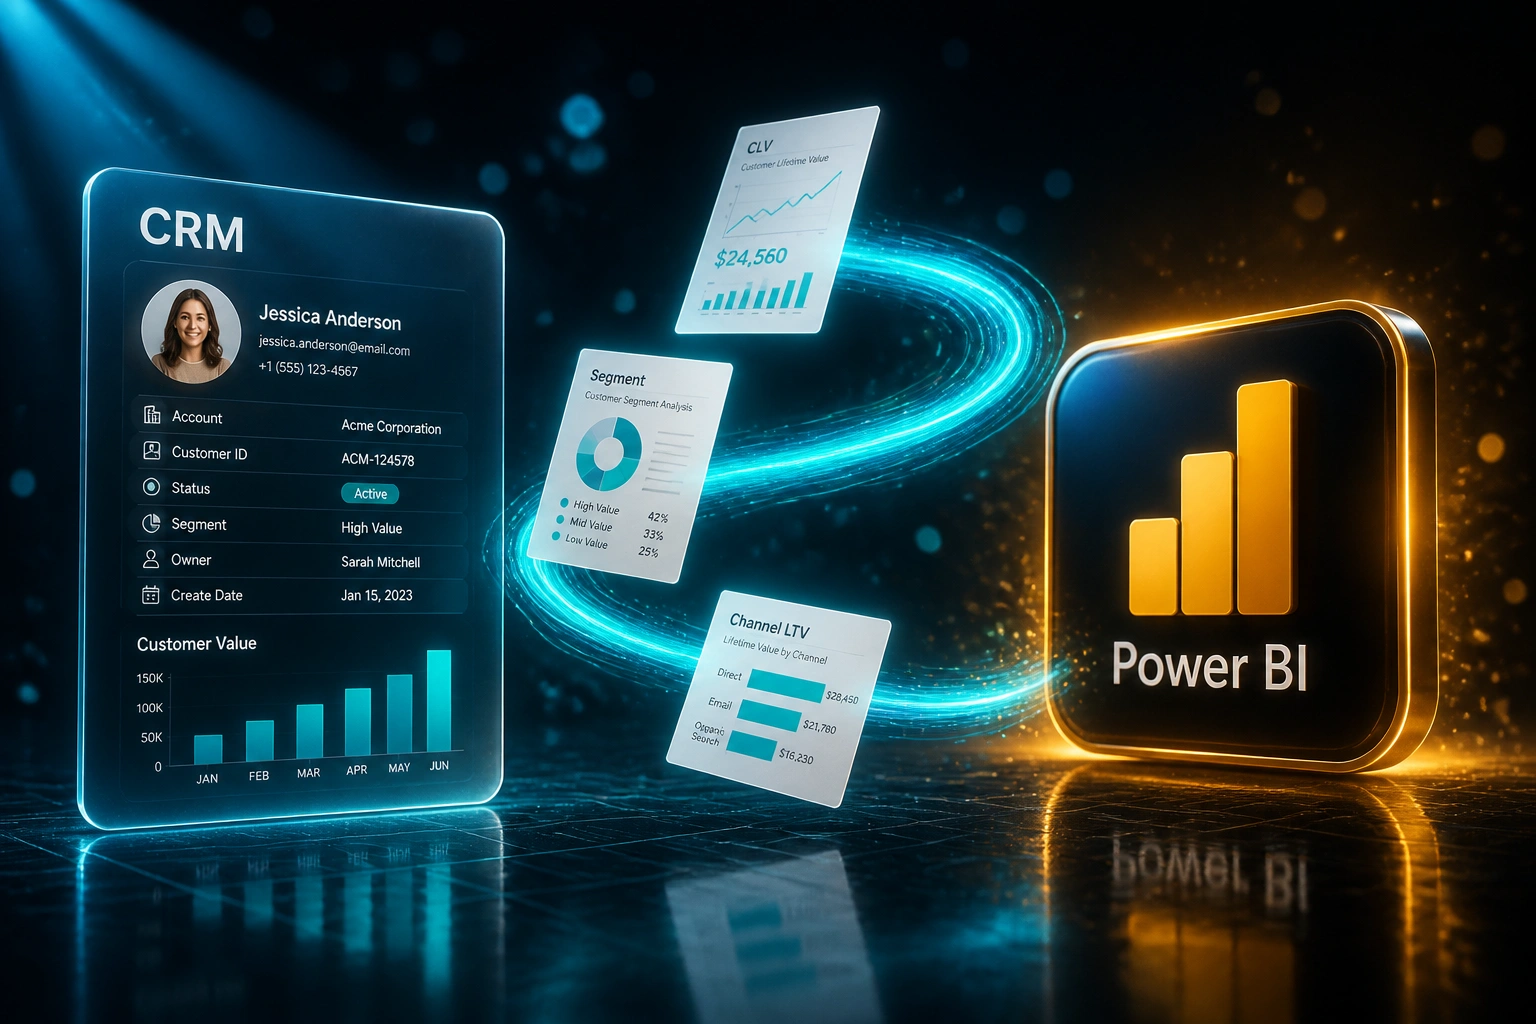
Sound Familiar?
These are the exact issues CEOs and marketing leads brought us before we built their CLV reporting:
- Marketing spends heavily on channels that look cheap on CAC but deliver customers who churn before they pay back
- Finance and marketing argue over customer profitability because CRM revenue, invoices, and retention live in separate exports
- CLV is rebuilt in Excel every week, taking 10+ hours and breaking whenever an API field changes
- Blended LTV:CAC looks healthy while low-value cohorts quietly drain acquisition budget
- Budget reallocations wait weeks because nobody trusts the spreadsheet enough to cut a loud channel
Acquisition is getting more expensive while measurement is getting worse. Google Ads cost-per-lead rose about 5% from 2024 to 2025 after a 24% jump the year before, and Meta CPMs rose roughly 20% year on year into 2026. Privacy changes and iOS tracking limits mean platform ROAS is less trustworthy, so customer profitability has to come from first-party CRM and invoice data.
What Customer Lifetime Value Reporting Actually Does
CRM and invoices sync in → retention attaches → segment and channel CLV drive acquisition decisions.
Revenue Sources Join
CRM deals, invoice totals, and acquisition channel tags land in one customer record
Retention Feeds CLV
Repeat purchases, renewals, and churn dates update lifetime value without a manual rebuild
Segments Rank
High-value, mid-value, and low-value cohorts show LTV:CAC beside acquisition spend
Budget Reallocates
Marketing cuts low-LTV channels and shifts spend to cohorts that actually pay back
Everything You Need for Trusted CLV Reporting
Unified CLV Reporting
CRM revenue, invoice totals, and retention signals join into one customer lifetime value view so profitability is not a Friday spreadsheet project.
Segment Profitability
See which customer segments actually pay back acquisition cost, and which cohorts look cheap to acquire but never become profitable.
Channel LTV Comparison
Compare lifetime value and LTV:CAC by acquisition channel so you stop overfunding low-LTV traffic that only wins on first-order CPA.
Retention & Revenue Sync
Repeat purchases, renewals, and churn dates feed the model automatically so CLV stays current without manual cohort rebuilds.
Acquisition Guardrails
Flag channels and segments below a healthy LTV:CAC threshold so marketing can cut or cap spend before more budget is wasted.
Board-Ready Profitability Packs
Scheduled Power BI, Looker, or Metabase packs show customer profitability and payback to the CEO, CFO, and marketing lead from the same source of truth.
Systems We've Wired into CLV Reporting
From 12 Hours/Week Spreadsheets to Live Customer Profitability
How a Johannesburg retail brand stopped overfunding low-LTV Meta cohorts and recovered acquisition budget within a quarter.
The Manual Process
- Marketing analyst rebuilt CLV in Excel every Friday from HubSpot, Xero, and ad exports
- Blended LTV:CAC looked near 2.5:1 while one Meta prospecting cohort sat below 1.5:1
- Cheap CPA channels kept winning budget because first-order cost looked efficient
- Finance disputed the numbers whenever VAT or refunds were missing from the sheet
- Reallocation debates waited until someone finished the weekly rebuild
The Live CLV View
- CRM revenue, invoices, and retention refresh into Power BI overnight
- Segment and channel LTV:CAC sit on the same board pack for CEO, CFO, and marketing
- Low-LTV Meta prospecting cut 40%; spend shifted to high-value search and retention offers
- Blended LTV:CAC moved from 1.8:1 to 3.4:1 within two quarters
- Weekly spreadsheet rebuild retired; leadership reviews live customer profitability
Before vs After CLV Reporting
How It Works
From first conversation to live customer lifetime value reporting in 2–4 weeks.
Tell Us Your Stack
Which CRM, accounting system, and BI tool you use, and how you currently estimate customer lifetime value.
Free Scoping Call
30-minute call to map revenue, retention, and channel fields, then agree the CLV definitions your board will trust.
Build & Validate
We join CRM, invoices, and retention into one CLV model, then reconcile a parallel month against your old spreadsheet.
Go Live & Coach
Switch off the weekly CLV rebuild. Your marketing and finance leads get a live profitability view plus a short handoff.
Frequently Asked Questions
How long does customer lifetime value reporting take to set up?
A focused CLV dashboard joining CRM revenue, invoices, and channel attribution typically takes 2–4 weeks from scoping to go-live. Broader setups with multi-segment models, retention cohorts, and board packs usually land in 4–6 weeks.
Which systems feed the CLV reporting view?
We commonly connect HubSpot, Salesforce, Pipedrive, Xero, QuickBooks, Power BI, Looker, Metabase, Google Ads, and Meta Ads. If the tool has an API or reliable export for revenue, retention, or spend, we can bring it in.
Is this the same as a marketing performance dashboard?
No. Campaign ROI dashboards show spend, CPL, and closed-won attribution. CLV reporting answers a different question: which customers and channels deliver long-term profitability after acquisition, not only first-order conversions.
How do you handle rising ad costs and broken attribution?
We anchor on first-party CRM and invoice revenue, then layer channel and segment LTV beside acquisition spend. As privacy rules and rising CPCs make platform ROAS less trustworthy, customer profitability becomes the budget decision metric.
Can finance and marketing share the same CLV numbers?
Yes. That is the point. Both teams work from the same joined model in Power BI, Looker, or Metabase, so customer profitability debates stop being a fight over whose export is right.
How much does CLV reporting cost?
Straightforward one-way reporting feeds start from around R15,000. Multi-source CLV models with segment, channel, and retention logic typically range from R25,000 to R60,000. Teams wasting acquisition budget on low-LTV cohorts usually recover the investment within 2–3 months of better allocation.
Stop Overspending on Low-Value Cohorts
If acquisition spend is rising and you still cannot see which segments repay it, you are guessing with budget that should be working harder.
Tell us which CRM and accounting system hold revenue, how you currently estimate customer lifetime value, and which channels take the most spend. We will show you how CLV reporting would look for your stack.