Customer Profitability Analysis: Automate Revenue and Cost Attribution Per Client
You know you need true margin per client. Instead, finance rebuilds the model in Excel every month while billing, time tracking, and support costs stay in separate tools. Pricing and resourcing decisions run on stale gut feel.
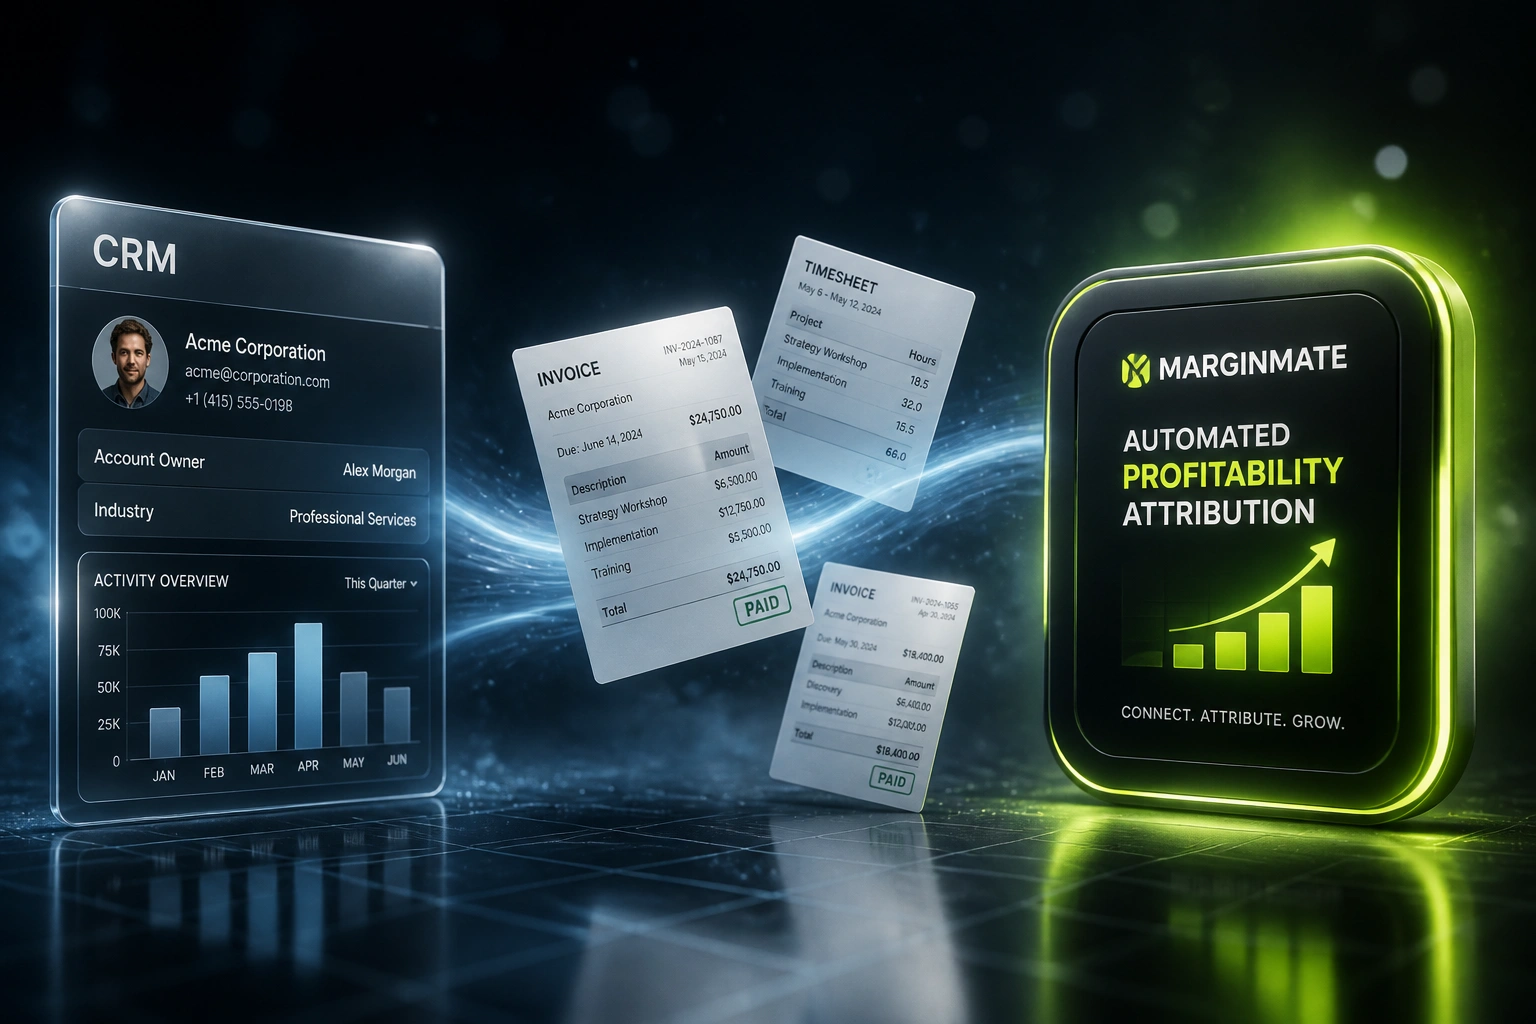
We wire the plumbing so account profitability refreshes automatically every week.
Sound Familiar?
These are the exact issues our clients faced before continuous revenue attribution and customer costing:
- Finance rebuilds the account profitability model in Excel every month from scratch
- Billing, time tracking, and support tickets live in separate tools with no shared client key
- Retainer fees look healthy until fully loaded labour and support costs are attributed
- Write-offs and unbilled hours surface weeks late, after pricing decisions are already locked
- Ops and finance argue over whose numbers are right instead of acting on a single margin view
Rising wage bills and underpriced retainers are compressing SA agency margins. Firms that still cost clients from last month's spreadsheet routinely underestimate true cost to serve by 20–40%, and professional services revenue leakage averages about 4.5% of revenue where it is measured at all.
What Continuous Account Profitability Looks Like
Billing posts → time costs → support attributed → margin refreshes. No human rebuilding the model.
Revenue Lands
Invoices and retainers sync from your accounting system to each client account
Labour Costed
Approved hours convert to fully loaded cost using your grade rates and overhead rules
Support Attributed
Tickets map to accounts at your agreed cost-per-ticket so high-touch clients show their true load
Margin Refreshes
Contribution margin per account updates on schedule, with alerts when an account slips
Everything You Need for Reliable Customer Costing
Revenue Attribution by Account
Invoices and retainers from Xero, Sage, or QuickBooks land against the right client every night, so billed revenue is always current.
Time Cost Roll-Up
Hours from Harvest, Clockify, Toggl, or Monday.com convert to fully loaded labour cost per account using your rate cards and overhead rules.
Support Cost Attribution
Zendesk, Freshdesk, or HubSpot Service tickets map to accounts with a cost-per-ticket rate, so high-touch clients stop hiding inside average margins.
Weekly Margin Refresh
True contribution margin per client recalculates on a schedule you choose. No analyst re-keys data. No stale month-end spreadsheet.
Exception Alerts
Accounts that drop below a margin threshold, burn through retainer hours, or spike in support tickets trigger alerts before the next board pack.
Single Client Key
We map CRM IDs, accounting contacts, project codes, and ticket organisations into one account record so costing never double-counts or misses a stream.
Systems We've Wired Into Profitability Pipelines
From 90 Hours/Month to 4 Hours/Month
How a 28-person Cape Town agency stopped rebuilding account profitability in Excel and started acting on weekly margin.
The Manual Process
- Finance exported Xero invoices, Harvest hours, and Zendesk ticket counts into three sheets
- Two analysts spent most of the first week of every month matching client names by hand
- Support cost was guessed as a flat overhead, so high-touch retainers looked healthier than they were
- By the time the model was ready, the numbers were already three to four weeks stale
- Pricing reviews and resource plans ran on last month's gut feel, not live account profitability
The Automated Process
- Nightly sync pulls revenue, approved hours, and tickets onto a single client key
- Fully loaded labour rates and a cost-per-ticket rule refresh contribution margin every Monday
- Accounts below a 25% margin threshold alert the ops lead before the next retainer renewal
- Finance reviews exceptions for about four hours a month instead of rebuilding the workbook
- Underpriced retainers and support-heavy accounts show up in time to renegotiate or re-scope
Before vs After Continuous Attribution
How It Works
From first conversation to live weekly attribution in 3–5 weeks.
Tell Us Your Setup
Which billing, time, and support tools you use, how you currently cost clients, and where the spreadsheet breaks.
Free Scoping Call
30-minute call to map data sources, define margin rules, and design the weekly attribution pipeline.
Build & Test
We wire the integrations, reconcile against your last two closed months, and run parallel until the numbers match.
Go Live & Monitor
Switch off the monthly rebuild. Monitoring and alerts keep account profitability updating without babysitting.
Frequently Asked Questions
How long does a customer profitability analysis system take to set up?
A standard build that connects billing, time tracking, and support into a weekly margin view takes 3–5 weeks from scoping to go-live. Simpler two-source attribution (billing plus time only) can be live in about two weeks. Multi-entity or multi-currency setups take closer to 5–7 weeks.
Which tools can feed into account profitability?
We routinely connect Xero, Sage, and QuickBooks for revenue; Harvest, Clockify, Toggl Track, and Monday.com for time; and Zendesk, Freshdesk, and HubSpot Service for support costs. If your tool has an API or reliable export, we can include it.
Will this replace our accounting or time-tracking tools?
No. Your team keeps working in the systems they already know. We build the plumbing that attributes revenue and cost to each account automatically. The profitability view sits on top; it does not replace Xero or your timesheets.
How do you handle overhead and fully loaded labour rates?
During setup we agree your rate-card rules: salary plus benefits and a share of overhead, or a simpler blended cost per hour by grade. Those rules drive every weekly refresh so margin is comparable across accounts, not a one-off spreadsheet formula.
What if our client names do not match across systems?
That is the usual failure mode. We build a client-matching layer on email domain, VAT number, and CRM ID, with a short review queue for ambiguous matches. Once mapped, new invoices and tickets inherit the same account key.
How much does a profitability attribution integration cost?
Two-source syncs (billing plus time) typically start around R25,000. Full billing, time, and support attribution with weekly refresh and alerts usually sits between R40,000 and R75,000. Most firms recovering 80+ hours a month of analyst time see ROI inside one to two months.
Stop Rebuilding Account Profitability in Excel
If finance is still stitching billing, timesheets, and support into a monthly workbook, you are paying for a problem that continuous attribution already solves.
Tell us which tools hold your revenue, labour, and support costs, and how you currently judge client margin. We will show you exactly how a weekly profitability pipeline would work for your agency or professional services firm.