Data Quality Alerting: Catch Issues Before They Spread
You discover data problems weeks late, when the board pack is wrong or invoices bounce. By then the same defect has already rewritten CRM, ERP, and the warehouse. Late discovery multiplies cost; early alerting turns a R500k mess into a 30-minute fix.
We build the alerting pipeline that notifies your team the moment records fail validation, thresholds shift, or anomalies appear.
Sound Familiar?
These are the exact issues our clients faced before they had a real alerting pipeline:
- Board packs and month-end invoices are wrong before anyone realises a validation rule failed two weeks earlier
- Finance discovers bad VAT numbers, duplicate invoices, or null customer keys only when payments bounce
- Ops hears about pipeline anomalies from sales or the board, not from the systems that produced them
- Slack is either silent for weeks or flooded with noise, so real quality thresholds get ignored
- Nobody owns the fix: alerts have no ticket, no owner, and no SLA, so the same defect spreads across CRM, ERP, and the warehouse
POPIA Section 16 requires reasonably practicable steps to keep personal information accurate and up to date. Discovering corrupted customer records weeks later in a board pack is not only expensive. It is hard to defend in an audit when you had no monitor, no alert trail, and no owner SLA.
What the Alerting Pipeline Actually Does
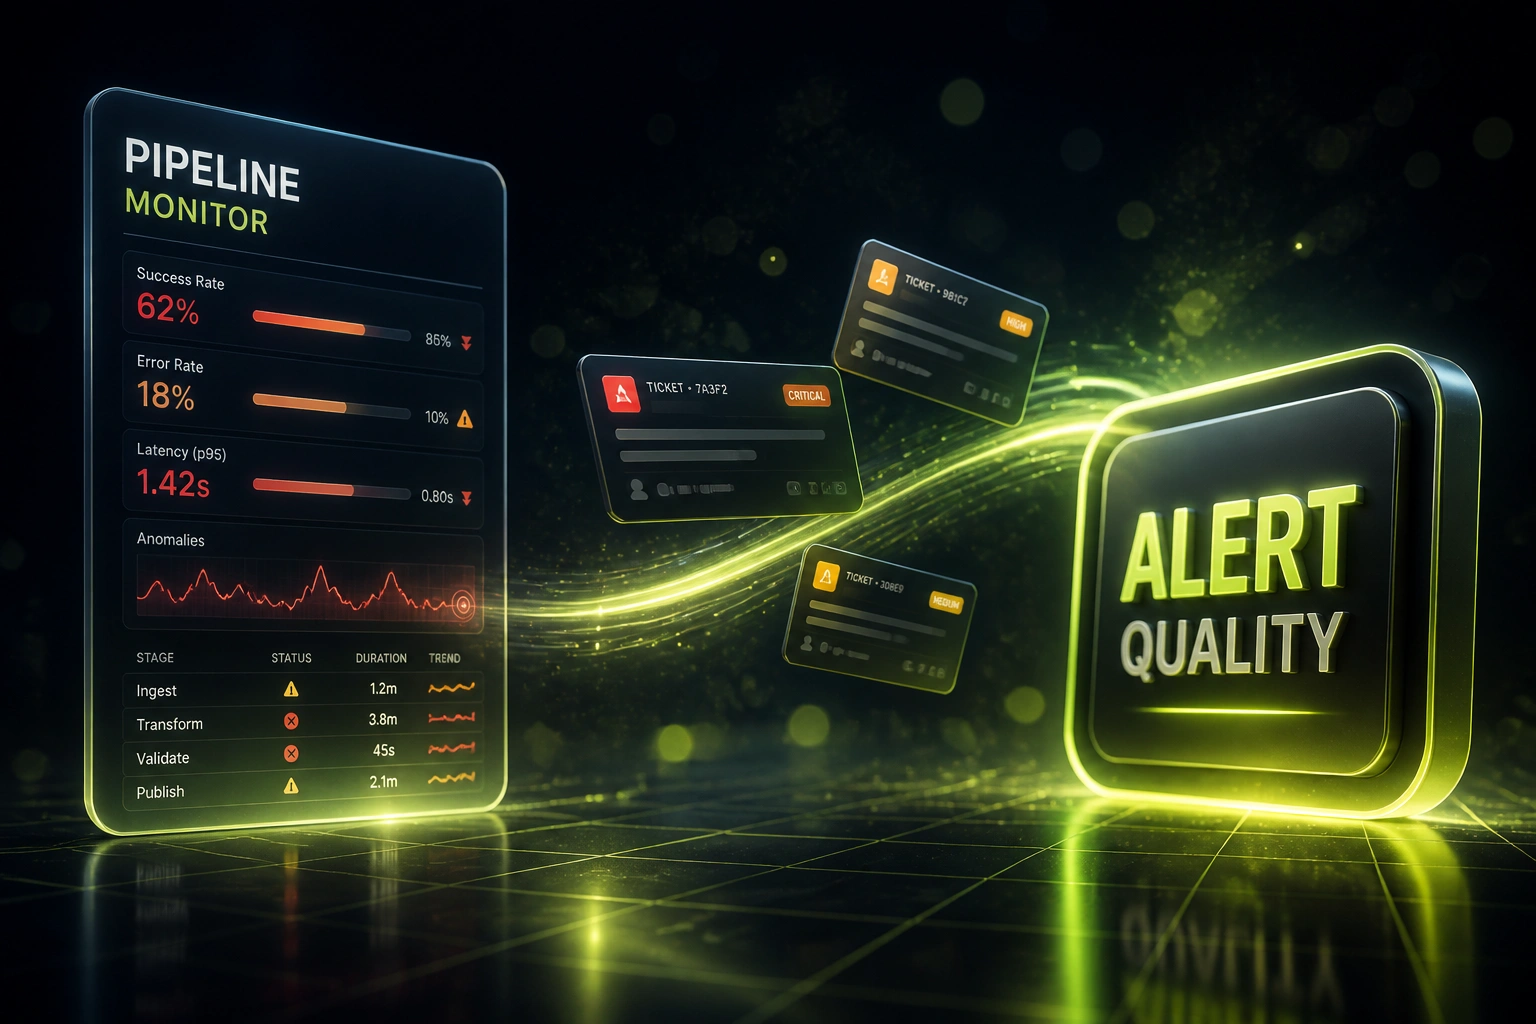
Threshold fails → anomaly confirmed → team notified → ticket owned. Catch it before it spreads.
Rule or Threshold Fires
Validation rules, freshness SLAs, null rates, or volume baselines breach on a critical table or sync
Anomaly Confirmed
Context, sample rows, and severity attach so the alert is actionable, not another vague red light
Notify Slack / Teams / WhatsApp
The right channel gets the alert by severity, with email as the audit trail for every incident
Ticket, Owner, SLA
A ticket opens with a named owner and a fix clock. Escalation fires if the SLA slips
Everything You Need for Useful Quality Alerts
Threshold & Rule Monitors
Volume, null rates, uniqueness, freshness, and business rules fire the moment a quality threshold is breached, not when a human opens a dashboard.
Anomaly Detection
Baseline drift and unexpected spikes surface as anomalies before they rewrite invoices, inventory, or the board pack. Your team sees the shift while it is still small.
Multi-Channel Alert Routing
Critical failures reach Slack, Microsoft Teams, email, or WhatsApp with the dataset, rule, and sample rows. Severity decides the channel so P0 never dies in a noisy thread.
Ticket & Owner Assignment
Every alert opens or updates a ticket with a named owner. No more orphaned messages. The right person owns the fix from the first notification.
Fix SLAs & Escalation
Response and resolution clocks start when the alert fires. Missed SLAs escalate to the ops lead so late discovery does not become late remediation too.
Noise Control
Deduplication, severity tiers, and tuned thresholds keep false positives under control. Useful data quality alerts stay actionable instead of training the team to ignore them.
Channels and Tools We Route Alerts Through
From 12-Day Blind Spots to Sub-Hour Alerts
How a 45-person distribution business stopped learning about bad invoices from customers and started fixing them before the next sync ran.
Late Discovery
- Ops learned about null customer keys when finance chased bounced invoices
- Average detection sat near two weeks; the last bad batch had already hit CRM and Xero
- One board pack shipped with revenue off by R520,000 before anyone checked the source tables
- Slack had no quality channel; email digests arrived after the damage was done
- Fix work took days of forensic matching across warehouse, CRM, and billing
Proactive Alerting
- Threshold and anomaly monitors watch overnight loads and CRM syncs
- Critical failures hit Slack and WhatsApp within minutes, with sample rows attached
- Every alert opens a Jira ticket with an owner and a same-day fix SLA
- Noise tuned so false positives stay low and the team still trusts the channel
- The next volume spike was fixed in under 30 minutes before invoices regenerated
Before vs After the Alerting Pipeline
How It Works
From first conversation to live alerting in 3–5 weeks.
Tell Us Your Setup
Which pipelines matter, which quality rules already exist, and where late discovery has already cost you a board pack or bounced invoices.
Free Scoping Call
30-minute call to map critical tables, threshold rules, alert channels, owners, and the SLAs that would have caught your last incident early.
Build & Test
We wire monitors, anomaly checks, routing, and tickets on a held-out window, tune noise with your ops lead, then run parallel alerting for a week.
Go Live & Monitor
The alerting pipeline goes live. Threshold breaches and anomalies notify the right channel with an owner and SLA before bad records spread.
Frequently Asked Questions
How is a data quality alerting pipeline different from a monitoring dashboard?
Dashboards wait for someone to look. An alerting pipeline watches thresholds and anomalies continuously, then notifies Slack, Teams, email, or WhatsApp the moment a rule fails, with a ticket, owner, and SLA. Monte Carlo's 2024 survey found 70% of data leaders still take longer than four hours to detect an incident. Alerting is how you compress that to minutes.
Will this flood our Slack with noise?
Not if it is designed properly. We tier severity, deduplicate repeats, and tune thresholds so actionable alerts stay the majority. Well-tuned systems target under 10% false positives and above 80% actionable alerts. Noise is a configuration problem, not a reason to stay blind.
Which systems and channels can you connect?
We monitor warehouses, ETL jobs, CRM and ERP syncs, and operational databases, then route alerts to Slack, Microsoft Teams, email, WhatsApp, Jira, Linear, ServiceNow, or custom webhooks. If the data lands somewhere queryable and your team already lives in a chat or ticket tool, we can wire the pipeline.
How does early alerting reduce cost compared with finding issues at month-end?
The Sirius Decisions 1-10-100 rule still holds: it costs roughly R1 to verify a record at entry, R10 to clean it later, and R100 once it has spread. Catching a threshold breach in thirty minutes turns a multi-week, multi-system mess into a contained fix. Two-thirds of organisations in Monte Carlo's survey had an incident costing R1.6 million or more in a six-month window.
Does this help with POPIA and audit readiness?
Yes. POPIA Section 16 requires reasonably practicable steps to keep personal information complete, accurate, not misleading, and updated. An alerting pipeline with timestamps, owners, and resolution history is evidence you detect and correct quality failures, rather than discovering them weeks later in a board pack or regulator enquiry.
How much does a data quality alerting pipeline cost?
Focused alerting for a critical path typically starts from around R35,000. Broader coverage across warehouse, CRM, and ERP syncs with multi-channel routing, tickets, and SLAs usually ranges from R50,000 to R90,000. Against a single R1.6 million-class incident, most mid-market teams see payback within one billing cycle of prevented rework.
Stop Finding Data Problems in the Board Pack
If your team still discovers validation failures, threshold shifts, and pipeline anomalies weeks late, you are paying the multiplied cost of late discovery.
Tell us which pipelines matter, which channels your ops team actually reads, and what the last late incident cost. We will show you how a data quality alerting pipeline would have caught it in minutes, with an owner and an SLA attached.