Financial Close Optimisation: Identify and Remove Bottlenecks in Your Process
You know the financial close is broken, but you cannot see where the days go. Waiting on subsidiaries, spreadsheet consolidations, and approval queues quietly turn a week of work into two or three weeks of calendar time.
We map the bottlenecks, redesign the choke points, and automate them so close time moves from weeks to days.
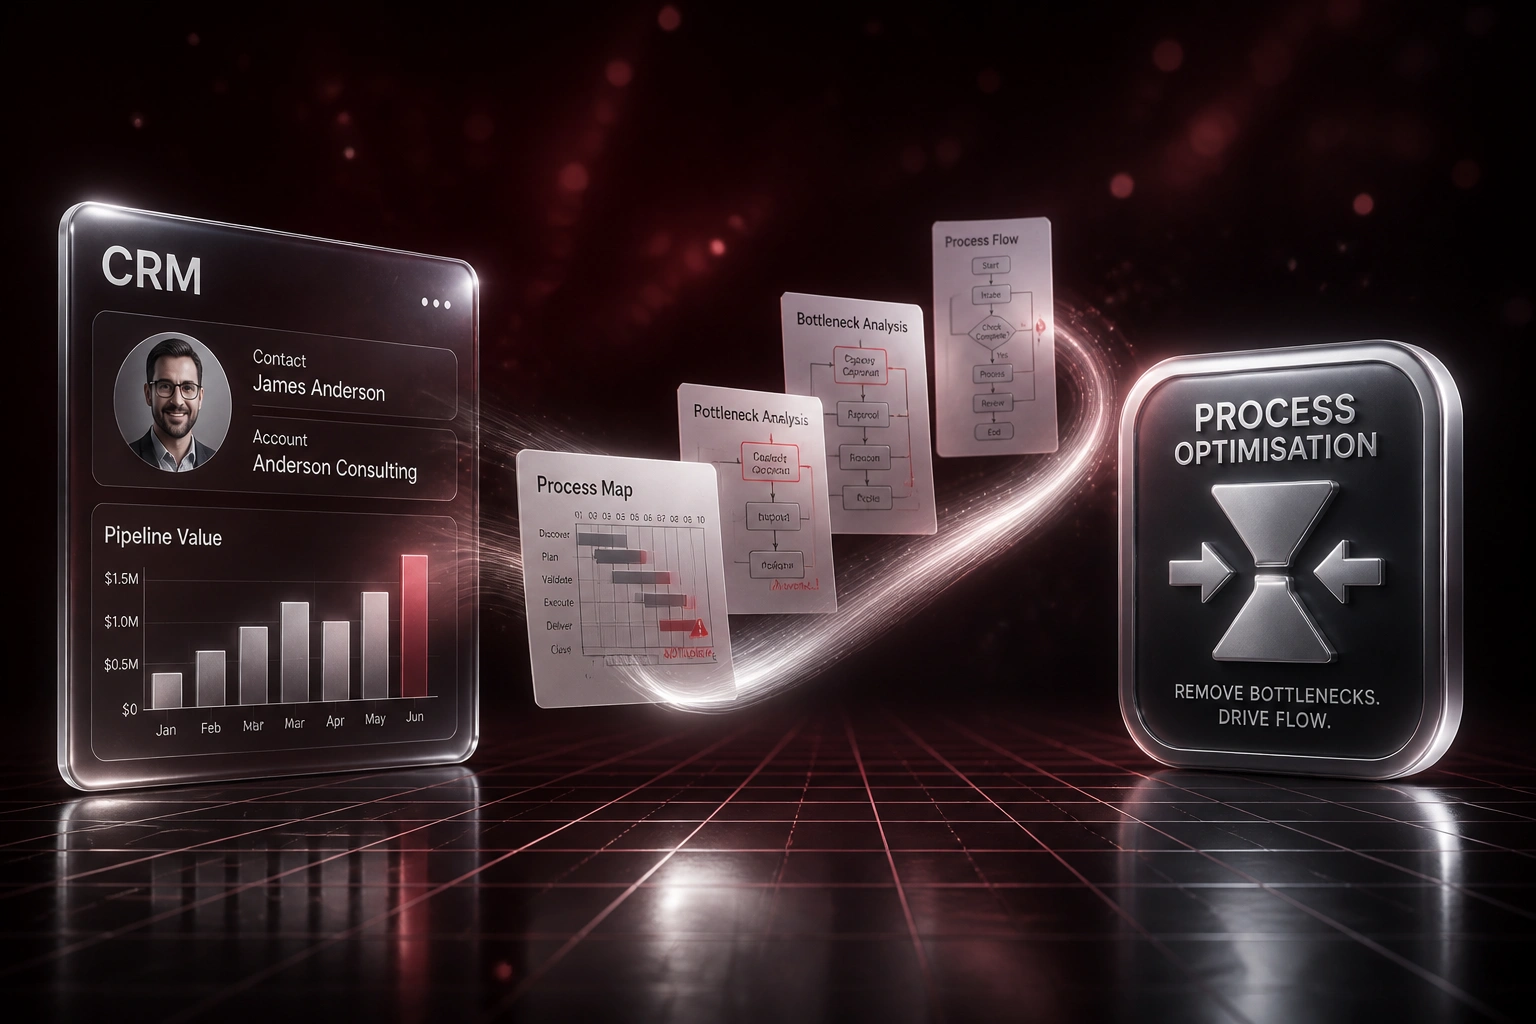
Sound Familiar?
These are the close bottlenecks CFOs and Heads of Finance recognise before a diagnostic map makes them measurable:
- You know the close is late, but nobody can show you which handoff burns the most calendar days
- Subsidiaries and departments submit late, so head office sits idle waiting rather than working
- Consolidation still lives in a fragile Excel workbook nobody fully trusts at audit time
- Approval queues for journals and intercompany items stack up overnight and over weekends
- Board and PE packs are due in 5–7 days while your close still stretches past two weeks
PE and board packs are expected within 5–7 business days, while SARS year-end and CIPC statutory work pile on at the same moments your close is already late. Without a map of close bottlenecks, finance keeps hiring effort into a process that is mostly waiting, not working.
What Close Process Optimisation Actually Does
Map → rank bottlenecks → redesign → automate. You stop guessing and start removing the days that are not value-add.
Map the Current Close
Every task, owner, system, and handoff across entities, recorded as a living process map
Find Where Days Accumulate
Separate active work from idle wait: subsidiaries, Excel consolidations, approval queues
Redesign the Choke Points
Parallelise, pre-close, and cut non-value-add loops before writing a single automation
Automate & Soft-Close
Wire the mapped bottlenecks and shift checks into the month so hard close compresses
Everything You Need to Remove Close Bottlenecks
Close Process Mapping
We document every task, owner, system, and dependency across your current close so waiting days and rework loops become visible, not anecdotal.
Bottleneck Time Analysis
Calendar days are split into active work versus idle wait: subsidiary submissions, spreadsheet handoffs, and approval queues ranked by days consumed.
Choke-Point Redesign
We redesign the slowest steps first: parallelise where work was sequential, pre-close what does not need month-end data, and cut non-value-add loops.
Targeted Finance Automation
Automate the mapped choke points: trial-balance pulls, consolidation feeds, intercompany matching cues, and status escalations into Xero, Sage, or your ERP.
Soft Close & Continuous Checks
Shift reconciliations and key controls into the month so Day 1 is review, not data gathering. Soft close habits shrink the hard close window.
Close Visibility Dashboard
CFOs see which entity, team, or task is blocking the path to books locked, with SLA clocks that escalate before the board deadline slips.
Systems We Wire Into Close Process Optimisation
From 14 Days to 5 Days
How a Gauteng multi-entity distribution group found where the days vanished, then removed the three choke points that owned most of the calendar.
The Opaque Close
- Hard close ran 12–14 business days after month-end
- Three subsidiaries emailed trial balances; head office waited 3–4 days before consolidation could start
- One 40MB Excel consolidation workbook with fragile eliminations
- Journal and intercompany approvals sat in email over weekends
- Board pack always late relative to the 5–7 day PE reporting window
The Mapped Close
- Diagnostic map showed ~60% of calendar days were waiting, not doing
- Subsidiary trial balances pulled on a schedule; waits dropped to hours
- Consolidation feeds replaced the master workbook for eliminations
- Approval escalations fired before items aged past 24 hours
- Soft-close checks through the month left Day 1–2 for review
Before vs After Close Bottleneck Removal
How It Works
From first conversation to a compressed live close in roughly 4–8 weeks.
Map Your Current Close
Walk us through the last close: entities, systems, handoffs, and where the calendar days actually went.
Free Diagnostic Call
30-minute call to rank bottlenecks by days lost, estimate weeks-to-days potential, and sketch the redesign.
Redesign & Automate
We rebuild the choke points, wire the automations, and run one parallel close beside your current process.
Lock the New Cadence
Switch to the compressed close. Monitoring keeps pulls, escalations, and soft-close checks healthy month after month.
Frequently Asked Questions
How is financial close optimisation different from a month-end checklist or recon automation alone?
Checklist automation tracks who owns which task. Recon and journal automation speeds individual steps. Close optimisation starts with a diagnostic map of where calendar days accumulate (waiting on subsidiaries, spreadsheet consolidations, approval queues), then redesigns and automates those choke points so the whole cycle compresses from weeks toward days.
What does a typical close look like before and after a bottleneck programme?
Industry benchmarks put many mid-market teams at 6–10+ business days, with multi-entity spreadsheet consolidations often stretching to 12–15 days. Teams that remove the mapped choke points commonly land in the 4–6 day band that PE boards and top-quartile peers expect. Exact outcomes depend on entity count and system fragmentation.
Will this disrupt year-end SARS and statutory reporting?
No. We design the new cadence to protect accuracy and audit trails. Faster close means earlier management packs and more runway into CIPC iXBRL filings, SARS year-end work, and statutory audits, rather than compressing everything into the same late scramble.
Do we need to replace our ERP or buy a full close platform?
Usually not. Most SA mid-market programmes keep Xero, Sage, QuickBooks, or the existing ERP and remove the manual glue around it: exports, consolidation workbooks, email chasing, and blind handoffs. If a purpose-built close tool is warranted later, the diagnostic map tells you what to buy and what to build.
How long does a close optimisation engagement take?
Diagnostic mapping and a ranked bottleneck report typically take 1–2 weeks. Redesign plus automation of the top choke points usually runs 4–8 weeks to the first compressed live close, including one parallel month. Multi-entity groups with heavy intercompany work sit toward the longer end.
How much does financial close process optimisation cost?
Focused diagnostic-plus-automation programmes for a single entity typically start from around R45,000. Multi-entity bottleneck redesign with consolidation feeds, escalations, and a close visibility board usually falls between R70,000 and R120,000. Teams recovering a week of FD and controller time each month usually see payback within two to four close cycles.
Stop Guessing Where the Close Days Go
If your financial close still stretches into the second or third week while the board expects numbers in days, the problem is rarely "work harder". It is unmapped waiting time.
Tell us how many entities you close, which systems hold the books, and which handoff always slips. We will show you a diagnostic path from weeks to days.