Fuel Cost Tracking: Monitor Consumption and Spot Anomalies Across Your Fleet
Every month your fuel cards and pump slips refuse to reconcile to odometer and trip data. Theft, idle burn, and inefficient vehicles hide in that noise while diesel keeps eating 35–45% of fleet operating cost.
We build the fuel intelligence layer that makes consumption monitoring automatic.
Sound Familiar?
These are the exact issues finance and fleet ops leads bring us before fuel tracking goes live:
- Fuel card statements and pump slips never reconcile to odometer or trip data
- Consumption spikes hide in monthly noise until the diesel bill is already paid
- Finance cannot tell theft from idle burn, inefficient vehicles, or genuine load variance
- Cost per kilometre is rebuilt in spreadsheets after month-end, too late to act
- Inefficient bakkies and trucks stay in the fleet because nobody tracks L/100km by vehicle
PASA's EMV fleet card migration (March 2026 deadline) and record petrol at R28.06/L inland in June 2026 mean magstripe fraud windows are closing while every unexplained litre costs more. If your reconciliation still lives in spreadsheets, the next diesel spike will hit harder than the last.
What Fuel Cost Tracking Actually Does
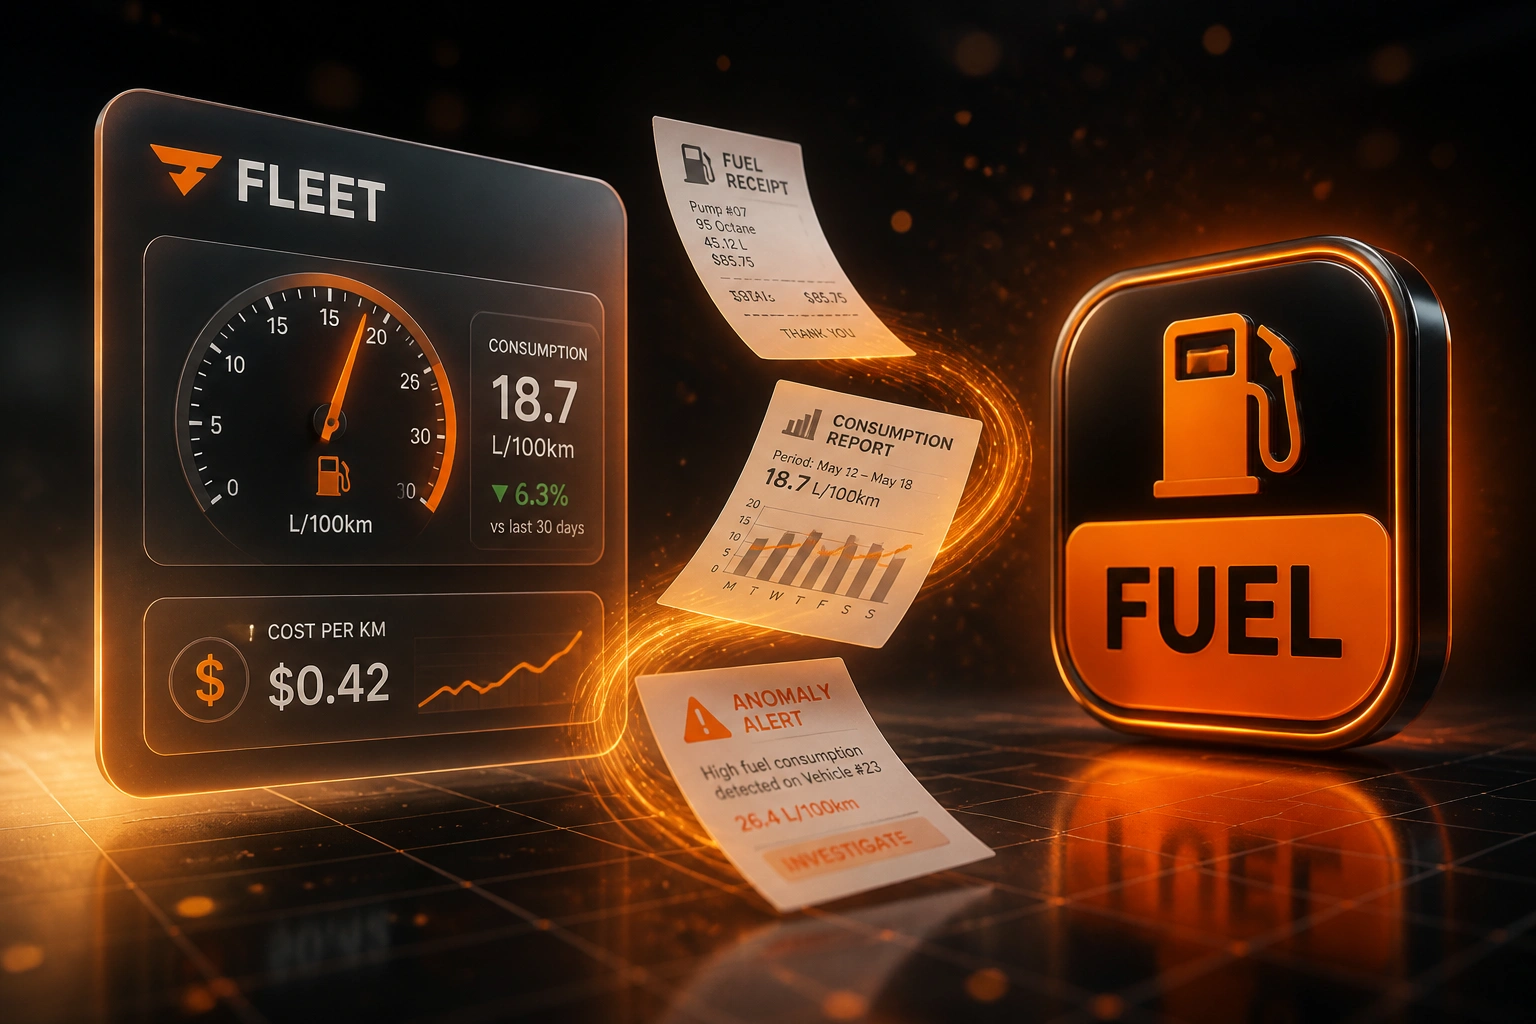
Purchase lands → consumption calculated → anomaly flagged → cost centre updated. No weekend spent matching slips to trips.
Fuel Purchase Captured
Card feed or pump slip posts against vehicle, driver, and location
L/100km & Cost/km
Litres matched to kilometres driven; Rand per km updates as prices move
Anomaly Alerted
Theft patterns, idle burn, and inefficient vehicles surface for review
Ledger Updated
Clean fuel journals land in Xero or Sage fleet cost centres
Everything You Need for Fleet Fuel Management Visibility
Purchase Capture & Matching
Every fuel card swipe and pump slip lands against the right vehicle, driver, and tank capacity. Phantom fills and out-of-route purchases surface the same day.
L/100km Consumption Monitoring
Live litres per 100 km by vehicle class, route, and driver. Bakkies that should sit near 7 L/100km and trucks near 40–50 L/100km get clear baselines, not gut feel.
Cost Per Kilometre Tracking
Rand-per-km updates as diesel prices move, so finance sees true fleet fuel costs in rand, not just litres bought last month.
Anomaly & Theft Alerts
Sudden drops, night fills, and consumption that exceeds tank capacity trigger alerts before the next statement cycle. Theft and waste stop hiding in the average.
Idle & Inefficient Vehicle Flags
Excessive idle hours and chronic high L/100km vehicles rise to the top of the weekly review so ops can coach, maintain, or retire the worst offenders.
Xero & Sage Cost Centre Sync
Fuel spend posts to the right fleet cost centres and tracking categories in Xero or Sage, so month-end fuel journals match the operations truth.
Sources and Ledgers We've Connected
From R1.1M in Unexplained Fuel to Same-Day Alerts
How a 28-vehicle Gauteng logistics fleet cut unexplained fuel spend by 11% and stopped reconciling card statements by hand.
The Manual Process
- Finance matched fuel card CSVs to odometer photos once a month
- Unexplained variance sat between 8% and 12% of a R480,000 monthly diesel bill
- Two bakkies ran well above 10 L/100km with no flag until tyres were shot
- Idle overnight burns and after-hours fills only appeared as "noise"
- Xero fuel journals were re-typed from card PDFs after every statement
The Automated Process
- Every fill matches vehicle, GPS, and tank capacity within hours
- L/100km and cost-per-km dashboards replace the month-end spreadsheet
- Anomaly alerts catch siphoning patterns and phantom fills the same day
- Inefficient vehicles and idle waste appear on a weekly ops review list
- Fuel posts to Xero fleet cost centres without re-keying
Before vs After Fuel Cost Tracking
How It Works
From first conversation to live fuel intelligence in 3–6 weeks.
Tell Us Your Fleet Fuel Stack
Card provider, telematics, ledger, how many vehicles, and where reconciliation fails each month.
Free Scoping Call
30-minute call to map purchase → consumption → anomaly → cost centre, and pick the first alerts that recover money.
Build & Baseline
We wire the feeds, set L/100km and cost-per-km baselines, and run parallel against last month's statements.
Go Live & Monitor
Switch off spreadsheet reconciliation. Alerts keep theft, idle waste, and inefficient vehicles visible every week.
Frequently Asked Questions
How long does fuel cost tracking take to implement?
A focused fuel intelligence layer typically takes 3–6 weeks from scoping to go-live. Simple card-to-ledger matching can be live in about two weeks. Full consumption monitoring with telematics matching and Xero or Sage cost centres usually sits in the 4–8 week range.
Will this replace our fuel cards or telematics?
No. We sit on top of the card provider and GPS or telematics you already use. The value is joining purchases to kilometres driven, then pushing clean cost centre journals into Xero or Sage.
How do you spot fuel theft versus normal variance?
We compare each fill to tank capacity, GPS location, trip distance, and the vehicle's L/100km baseline. Night fills off-route, litres that exceed capacity, and sudden consumption spikes get flagged for review instead of disappearing into the monthly average.
What about idle time and inefficient vehicles?
Idle hours from telematics convert to litres and rand at current diesel prices. Vehicles that sit well above class benchmarks (for example bakkies near 7 L/100km versus trucks at 36–50 L/100km) appear on a weekly exception list for maintenance, coaching, or replacement decisions.
Can fuel costs post into Xero or Sage automatically?
Yes. Purchases and allocated fuel cost can post to the right tracking categories and fleet cost centres so finance stops re-keying card CSV files at month-end. Your ledger remains the system of record.
How much does a fuel cost tracking build cost?
Focused purchase matching and reporting starts from around R25,000. Full consumption monitoring with anomaly alerts and accounting sync typically ranges from R40,000 to R90,000. Against R65,000 per year of siphoning risk on a single truck, or 3–5% fuel-card leakage on a mid-size fleet, most clients see payback inside one or two months of recovered fuel.
Stop Losing Rand on Unexplained Fuel
If your fuel card statements still do not reconcile to odometer and trip data, you are funding theft and waste that automated consumption monitoring already catches for fleets like yours.
Tell us which card provider and telematics you run, how many vehicles sit on the fleet, and where month-end fuel reconciliation hurts most. We will show you how fuel cost tracking would work for your cost centres.