Customer Profitability: Find Out Which Clients Actually Make You Money
Your sales director celebrates the biggest revenue accounts. Finance cannot prove which ones leave real margin after cost-to-serve and support overhead. You may be busy, growing, and quietly losing money on the clients you praise most.
We build the ranking that shows true profit per account, so you can fire unprofitable work, upsell winners, and stop celebrating vanity revenue.
Sound Familiar?
These are the exact issues our clients faced before they could see true client profitability:
- Sales celebrates the biggest revenue accounts while finance cannot say which ones actually make money
- Cost-to-serve is invisible: support tickets, custom work, and late payments never land on the client P&L
- Your top-billing client may be underwater once delivery hours and support overhead are fully loaded
- Pricing and renewals are decided on revenue rank, not true margin, so unprofitable work keeps growing
- Leadership debates growth targets while nobody can produce a ranked client profitability list
Labour-driven cost-to-serve has climbed sharply: support wages have risen roughly 15–20% since 2020, and phone-heavy teams have seen per-contact costs jump 20–35%. If you still rank clients by revenue alone while support overhead inflates, margin compression is already happening, whether the P&L shows it yet or not.
What the Customer Profitability Model Actually Does
Revenue in. Cost-to-serve loaded. Accounts ranked by true profit. Leadership acts on winners and destroyers.
Pull Account Revenue
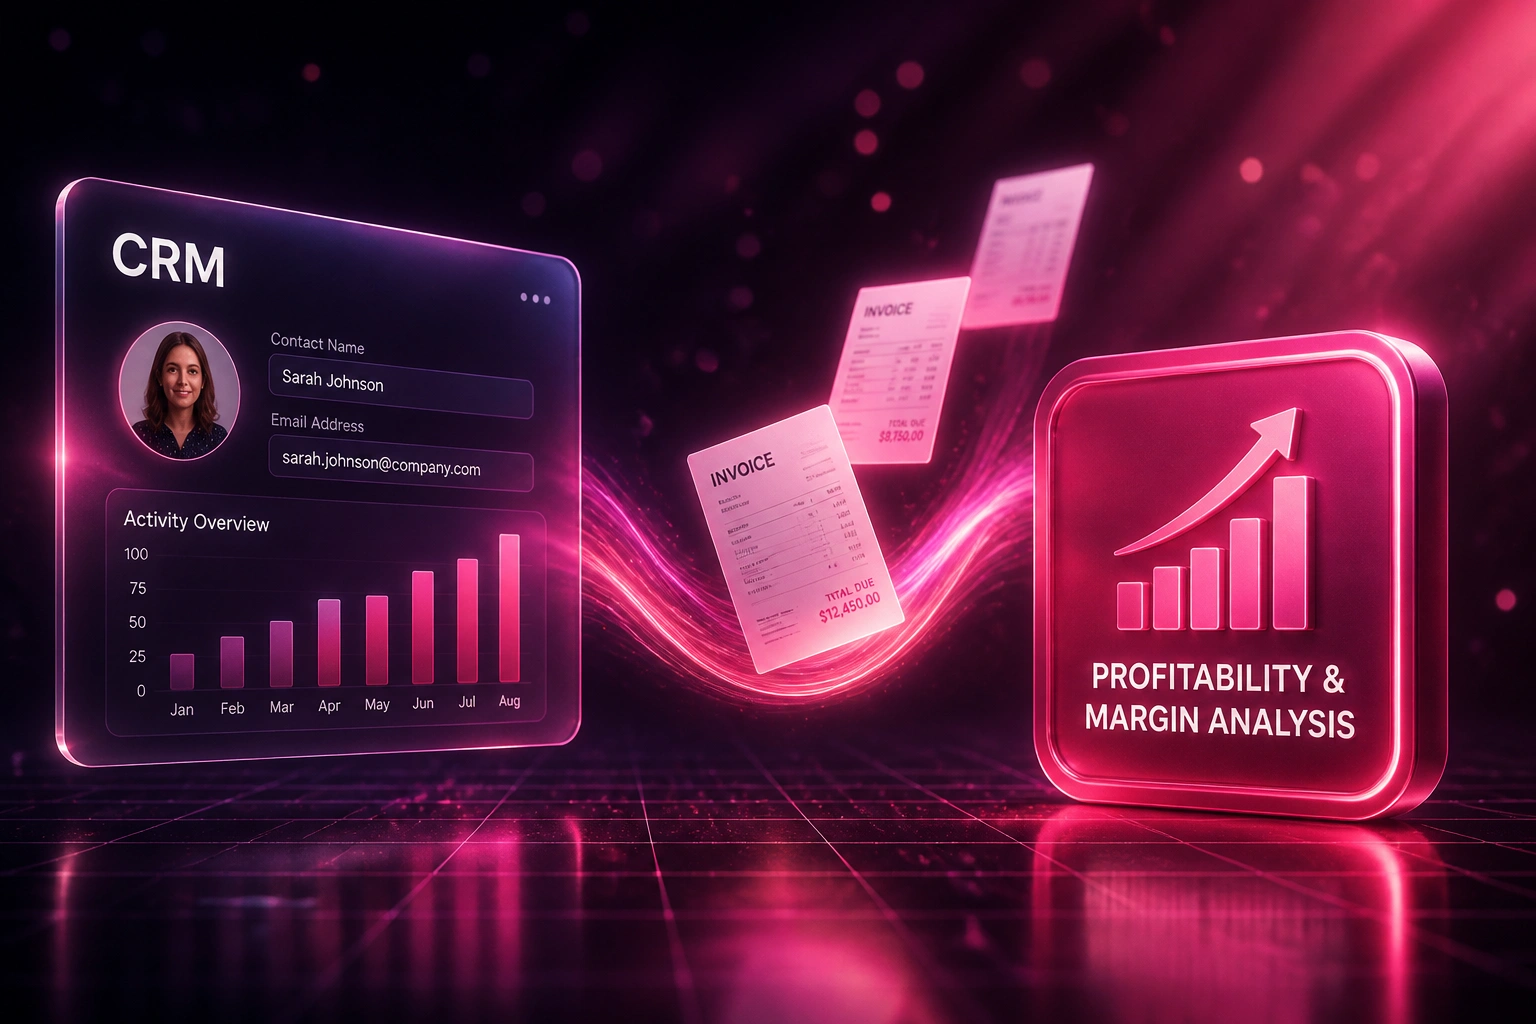
Invoices and contract value flow from CRM and accounting into a single client ledger
Load Cost-to-Serve
Delivery hours, support tickets, and overhead map to each account with clear allocation rules
Rank by True Margin
Every client gets a profitability score and position on the whale curve, not a vanity revenue rank
Act on the Ranking
Upsell winners, reprice or exit destroyers, and stop celebrating accounts that look big but lose money
Everything You Need for Client Analysis That Leadership Trusts
True Profit Ranking
Every account ranked by contribution margin after revenue, delivery cost, and support overhead, not by invoice total.
Cost-to-Serve Model
Support tickets, custom work, project hours, and payment friction roll into a clear cost-to-serve figure per client.
Whale Curve View
A cumulative profitability curve that shows which clients create profit, which break even, and which destroy margin.
Vanity Revenue Flags
High-revenue, low-margin accounts surface automatically so leadership stops celebrating clients that quietly lose money.
Upsell and Exit Actions
Winners get expansion playbooks. Underwater accounts get reprice, restructure, or exit recommendations with impact estimates.
Board-Ready Packs
Monthly client profitability packs for the CEO and sales director, delivered where you already work: email, Slack, or Teams.
Systems We've Connected for Margin Analysis
From Celebrating Revenue Heroes to Ranking True Profit
How a 35-person professional services firm discovered three of its five biggest clients were destroying margin, then recovered R2.1 million in year one.
Revenue Rank Only
- CEO and sales director tracked clients by annual billings in a spreadsheet
- Top five accounts represented 48% of revenue and dominated every board conversation
- Support tickets and delivery hours never appeared on the client P&L
- Two of the "hero" accounts demanded custom work and late-night escalations weekly
- Firm felt busy and growing while cash felt tighter every quarter
Profit Rank Live
- Revenue, project hours, and support tickets fed a monthly client profitability ranking
- Whale curve showed the top 20% of clients driving roughly 180% of profit
- Three celebrated accounts ranked in the bottom unprofitable band once cost-to-serve loaded
- Two accounts repriced and scoped; one exited; capacity shifted to high-margin winners
- Board packs named winners and destroyers in Rand, not revenue vanity
Before vs After Client Analysis
How It Works
From first conversation to a trusted profitability ranking in 4–8 weeks.
Map Your Data
Which CRM, billing, time tracking, and support tools hold revenue, hours, and tickets today.
Free Scoping Call
30-minute call to define cost-to-serve drivers, ranking rules, and the first profitability aha for leadership.
Build & Validate
We build the model, test on your real accounts, and run a parallel review so finance trusts the ranking.
Go Live & Act
Monthly packs start. You upsell winners, reprice or exit destroyers, and stop celebrating vanity revenue.
Frequently Asked Questions
How is customer profitability different from revenue reporting?
Revenue reporting ranks clients by how much they bill you. Customer profitability ranks them by how much margin they leave after cost-to-serve: delivery hours, support tickets, custom work, and payment friction. The biggest invoice is often not the most profitable account.
What data do you need to build a cost-to-serve model?
Typically CRM account records, invoicing from Xero or Sage, time or project hours, and support ticket volume from Zendesk, Freshdesk, or HubSpot Service. We start with what you already have and fill gaps with pragmatic allocation rules rather than waiting for perfect data.
Will this tell us to fire our biggest clients?
Not automatically. The model surfaces the truth so you can choose: reprice, change scope, move work to a lower-cost channel, or exit. Many firms recover margin by fixing a few underwater accounts without cutting revenue at all.
How is this different from a customer profitability analysis system that automates attribution?
Attribution plumbing wires billing, time tracking, and support costs into a continuous feed. This page is the insight layer for leadership: a clear ranking and whale curve so the CEO and sales director finally see which clients make money versus which look big and destroy margin.
Which platforms can feed the profitability ranking?
We have built client profitability views from HubSpot, Pipedrive, Salesforce, Zoho CRM, Xero, Sage, Zendesk, Freshdesk, and project tools such as Asana, Monday.com, and Harvest. If your stack has an API or reliable export, we can include it.
How much does a customer profitability model cost in South Africa?
A focused ranking with cost-to-serve drivers and a monthly board pack typically starts from around R35,000. Multi-system models with whale curves, vanity-revenue flags, and action playbooks usually fall between R50,000 and R90,000. Firms that exit or reprice a few underwater accounts often recover the fee in the first quarter.
Stop Celebrating Clients That Quietly Lose You Money
If your leadership still ranks accounts by revenue while cost-to-serve and support overhead stay invisible, you are managing vanity, not margin.
Tell us which CRM, billing, and support tools you use, and which accounts feel "big but expensive." We will show you how a customer profitability ranking would look for your business.