Sales Pipeline Forecasting Report: Revenue Prediction You Can Plan On
Your forecasts swing because reps sandbag or inflate, and hiring, inventory, and cash plans still rest on gut feel. Quarter-end surprises freeze headcount and leave stock sitting while the board loses trust in the number.
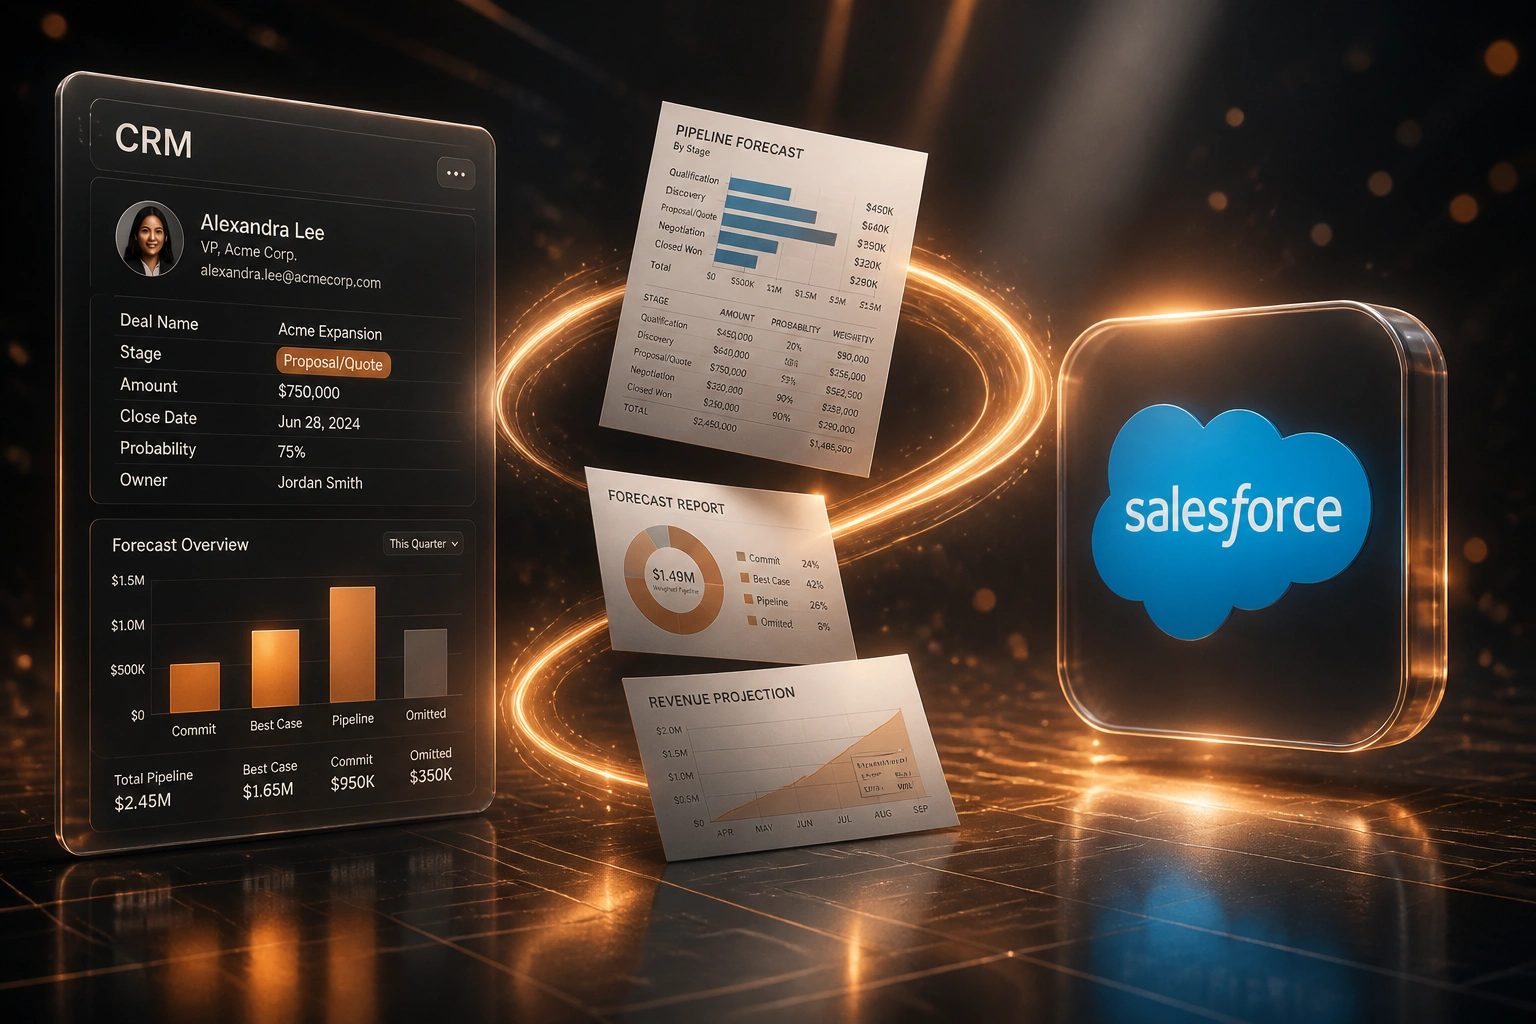
We build stage-probability-weighted pipeline forecasting reports that make revenue projection realistic.
Sound Familiar?
These are the exact issues our clients faced before a trustworthy forecasting report:
- Quarterly sales forecasts swing so hard that finance freezes hiring mid-plan, then scrambles when deals land late
- Reps sandbag commits or inflate pipeline, so leadership plans inventory and cash on gut feel instead of evidence
- CRM default stage probabilities overstate revenue prediction by 2× when historical win rates are never recalibrated
- CFO and sales director maintain separate spreadsheet forecasts that never reconcile before the board pack
- HubSpot and Salesforce native forecast views still leave resource planning exposed without a stage-weighted report model
Over-forecasting still drives premature hiring: roughly 14% of forecast error magnitude converts to wasted headcount spend, and about 9% lands in excess inventory and capacity. A R12M miss on a R60M book can burn R1.7M in over-hiring alone before cash planning catches up.
What Pipeline Forecasting Reports Actually Deliver
CRM deals → stage-weighted model → planning pack → hiring and cash decisions on one number.
Pipeline Lands in CRM
Open deals, stages, amounts, and close dates update in HubSpot, Salesforce, or your CRM
Stage Probabilities Apply
Each deal is weighted by calibrated stage probability and optional historical win rates
Forecast Report Publishes
Commit, best case, and weighted pipeline roll into a board-ready sales forecast pack
Plans Follow Reality
Hiring, inventory, and cash decisions rest on revenue prediction finance can defend
Everything You Need for a Trustworthy Sales Forecast
Stage-Probability Weighting
Every open deal is multiplied by calibrated stage probability (and optional historical win rates), so the sales forecast reflects realistic revenue prediction, not optimistic pipeline totals.
Board-Ready Forecast Packs
Scheduled pipeline forecasting reports roll commit, best case, and weighted pipeline into CFO-ready packs for cash, hiring, and inventory planning.
Historical Win-Rate Calibration
We back-test closed-won conversion by stage and segment, then replace CRM defaults with probabilities that match how your deals actually close.
Planning Scenario Views
Conservative, base, and upside revenue prediction scenarios map directly to headcount, stock, and working-capital decisions.
Hygiene Gates for Forecast Inputs
Past close dates, zombie deals, and missing amounts are stripped from the weighted model before they poison the report.
Finance and RevOps Alignment
One pipeline forecasting report becomes the shared number for sales directors, CFOs, and revenue ops, ending shadow forecasts.
Sources We've Wired into Forecasting Reports
From ±22% Forecast Chaos to ±7% Planning Confidence
How a mid-market B2B team stopped quarter-end surprises and avoided R1.8 million in over-hiring within one year.
Gut-Feel Planning
- Sales director and CFO kept separate spreadsheet forecasts that never matched
- Rep roll-ups swung ±22% each quarter, triggering mid-cycle hiring freezes
- Optimistic pipeline drove excess stock that tied up working capital
- CRM default probabilities overstated late-stage revenue prediction
- Board packs required a weekend of manual reconciliation before every review
Weighted Forecast Report
- Stage-probability model calibrated to three years of closed-won history
- One pipeline forecasting report shared by sales, finance, and rev ops
- Hiring and inventory plans keyed to conservative and base scenarios
- Quarterly variance tightened to ±7% for three consecutive quarters
- Board pack publishes automatically from CRM and Power BI
Before vs After Pipeline Forecasting Reports
How It Works
From first conversation to a live forecasting report in 3–5 weeks.
Measure Forecast Error
We quantify your miss rate, bias (sandbag vs inflate), and how far hiring and cash plans drift from actuals.
Design the Weighted Model
Stage probabilities, historical win rates, scenario bands, and the report pack finance will actually use.
Build Reports and Cadence
We configure CRM and BI outputs, then run parallel against your last two quarters to prove accuracy.
Lock and Recalibrate
Go live for planning, then retune probabilities each quarter so the sales forecast stays trustworthy.
Frequently Asked Questions
How is a pipeline forecasting report different from day-to-day deal tracking?
Deal tracking helps managers coach individual opportunities. A pipeline forecasting report is the planning model: stage-probability-weighted revenue prediction that CFOs and sales directors use for hiring, inventory, and cash. We build the trustworthy forecast deliverable, not another activity dashboard.
We already have HubSpot or Salesforce forecasting. Why do our plans still miss?
Native tools often ship with default stage probabilities that ignore your historical win rates. Combined with sandbagging, inflation, and stale deals, teams land in the ±15–25% median variance band. We recalibrate weighting, strip bad inputs, and package a report finance can plan against.
How accurate can sales forecast and revenue prediction get?
Benchmarks put elite teams at ±5–10% quarterly variance, while the median sits around ±15–25%. Rep roll-up commits often miss by ±25–35%; weighted pipeline methods typically land closer to ±18–25% before historical calibration. We design for the tighter band using your closed history.
Will this disrupt how sales directors run forecast calls?
No. Reps keep working in the CRM. The change is the number that leaves the meeting: a stage-weighted report that finance trusts for resource planning, instead of a gut-feel commit that swings every quarter-end.
Which systems can feed the forecasting report?
We have built pipeline forecasting reports from HubSpot, Salesforce, Pipedrive, Zoho CRM, and custom CRMs, with delivery into Power BI, Looker, or scheduled PDF/Excel packs. The craft is the probability model and planning cadence. The platform is secondary.
How much does a sales pipeline forecasting report cost in South Africa?
A focused stage-weighted forecasting report with historical calibration typically starts from around R45,000. Multi-entity packs with scenario planning, BI dashboards, and quarterly recalibration usually fall between R65,000 and R110,000. Teams recovering even one avoided over-hire or inventory miss often see ROI inside a single planning cycle.
Stop Building Hiring and Cash Plans on Gut Feel
If your sales forecast still swings every quarter-end, you are paying for over-hires, freezes, and inventory mistakes that a stage-weighted report would have prevented.
Tell us which CRM you run, how far last quarter missed, and which planning decisions hurt most. We will show you exactly how a pipeline forecasting report would work for your revenue prediction cadence.