AI Report Builder: Generate Business Reports from Plain Language
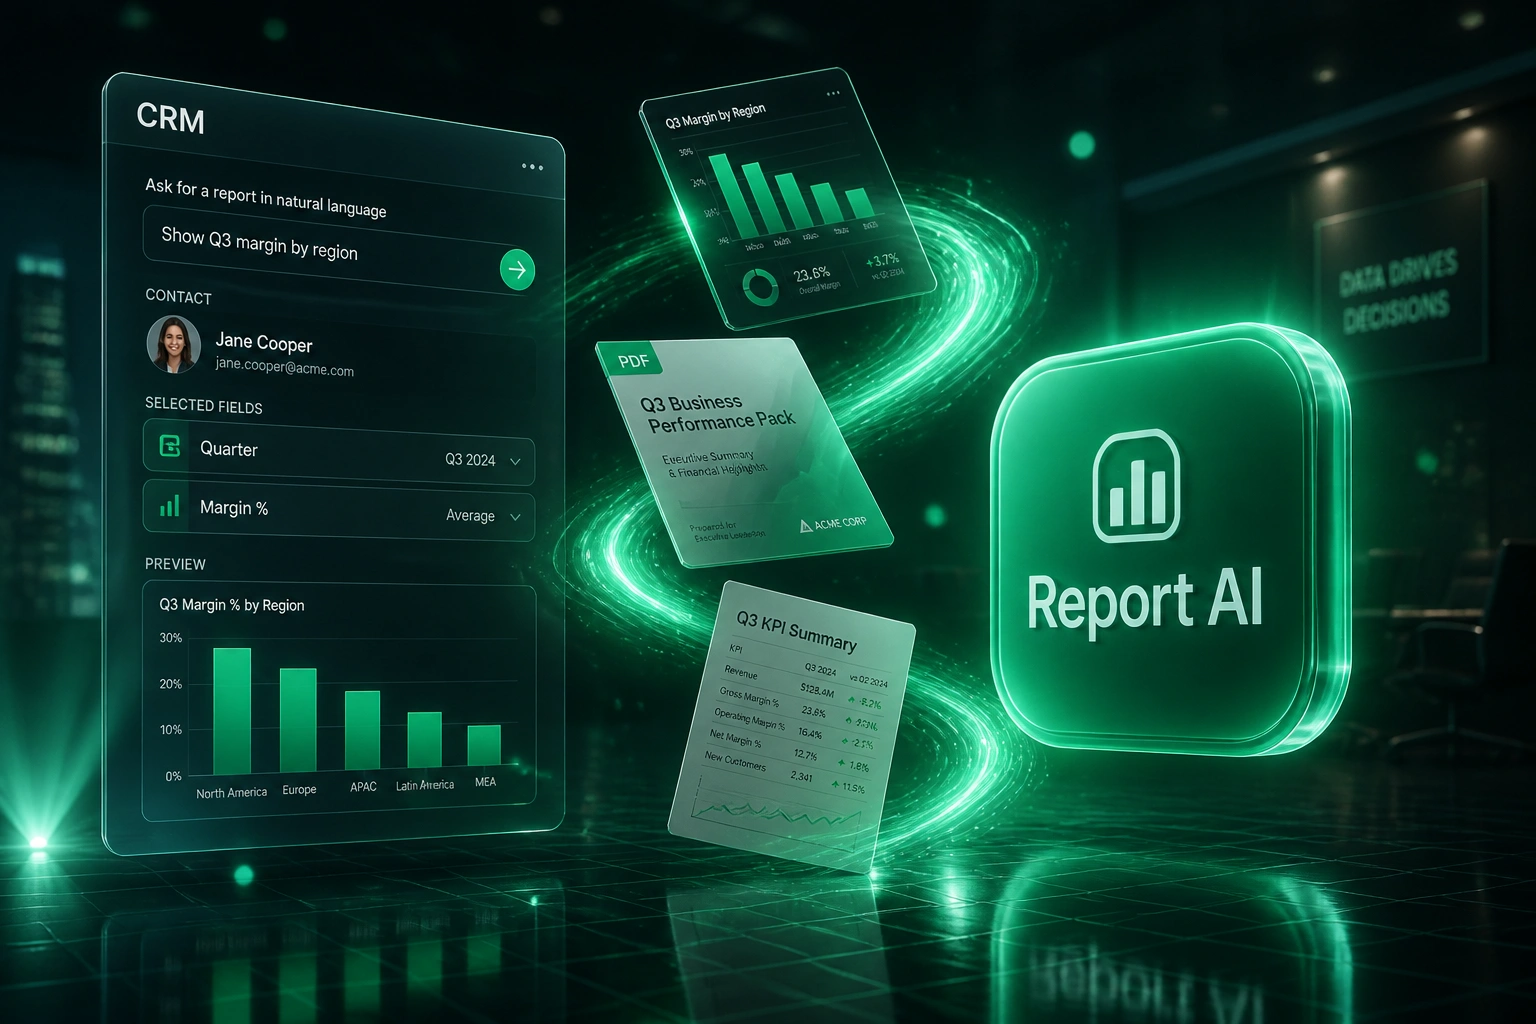
Your managers wait days for Excel packs while analysts clear a ticket queue of the same board and ops requests. Natural language reporting turns "show me Q3 margin by region with last year comparison" into a live chart dashboard and exportable pack in minutes, grounded in CRM and warehouse data with row-level governance.
We build the self-service analytics layer that retires the standard report ticket queue.
Sound Familiar?
These are the exact issues our clients faced before a natural language report builder:
- Managers wait two to four days for a standard Excel pack while the decision window closes
- Analysts spend most of the week clearing ad hoc tickets instead of improving models and forecasts
- Every Monday, ops and sales leads rebuild the same charts from CRM and warehouse exports
- Board and ops packs arrive stale: numbers from last week dressed up as this week's truth
- Row-level access is informal: someone emails a spreadsheet that should never have left the warehouse
Self-service BI has sat near a 20–30% adoption ceiling for years, while mid-market teams still burn the equivalent of R3.8M+ a year in manual reporting labour. NLQ and text-to-dashboard are finally pushing past that ceiling. Organisations that keep routing every board pack through a ticket queue fall further behind every Monday.
What the AI Report Builder Actually Does
Plain-language request → governed charts → exportable pack. No analyst ticket for the standard board and ops cadence.
Manager Types the Ask
Ops or finance types a request in plain language against the approved metric catalogue
Live Data Resolves
CRM and warehouse metrics resolve with row-level rules already applied
Dashboard Assembles
Charts, KPIs, and comparisons layout into a formatted dashboard preview
Pack Exports
PDF or spreadsheet pack downloads for the board pack or Monday ops review
Everything You Need for Self-Service Analytics Packs
Natural Language Report Requests
Managers type requests like "sales by region last quarter vs target" and receive a live chart dashboard plus an exportable pack, not a raw SQL answer or a blank sheet.
Formatted Dashboards & Charts
The builder lays out bar, line, and KPI tiles from your governed metric catalogue so board and ops packs look consistent every cycle.
Exportable Report Packs
One click produces PDF or spreadsheet packs for the Exco pack, regional review, or Monday ops huddle, grounded in the same live sources.
Row-Level Governance
Every answer respects warehouse and CRM permissions. A regional manager only sees their territory; finance sees the consolidated view.
CRM & Warehouse Grounding
Requests resolve against HubSpot, Salesforce, BigQuery, Snowflake, or your warehouse semantic layer, so charts match the numbers finance already trusts.
Self-Service Analytics Queue Relief
Standard board and ops packs leave the analyst ticket queue. Analysts keep the novel questions; managers self-serve the rest.
Platforms We've Grounded Report Builders On
From 3 Days to 12 Minutes per Pack
How a 180-person services group cut standard board and ops report tickets by 78% and recovered R485K in analyst capacity in year one.
The Ticket Queue
- Regional and ops managers lodged ~40 report tickets every week
- Standard packs (margin by region, pipeline vs target) took 2–4 days
- Two analysts spent ~25 hours a week clearing the same recurring requests
- Monday Excel rebuilds ate 4–5 hours of manager time before the ops huddle
- Spreadsheets circulated by email with no durable row-level control
The Report Builder
- Managers type the ask against a governed HubSpot and BigQuery catalogue
- Live chart dashboards assemble in minutes with period and region comparisons
- One click exports the PDF pack for Exco or the Monday ops review
- Row-level rules keep each region inside its own numbers
- Analysts keep novel questions; standard packs leave the queue
Before vs After the Report Builder
How It Works
From first conversation to live self-service packs in 4–6 weeks for a focused first wave.
Tell Us Your Pack Ritual
Which board and ops packs queue every week, which CRM and warehouse feed them, and which requests clog the analyst backlog.
Free Scoping Call
30-minute call to map the metric catalogue, row-level rules, export formats, and which natural language report templates earn automation first.
Build & Parallel-Run
We wire the AI report builder to your CRM and warehouse, train on past packs, and run self-service beside the ticket queue for two cycles.
Go Live & Retire the Queue
Managers request and export. Monitoring keeps freshness, governance, and pack quality healthy on every cadence.
Frequently Asked Questions
How is an AI report builder different from natural language SQL or AI narrative reports?
Natural language SQL returns a query answer. AI narrative generation writes prose commentary. An AI report builder turns a plain-language request into a formatted dashboard of charts and KPIs plus an exportable PDF or spreadsheet pack. CFOs and ops directors get the board-ready artefact, not a table dump or a paragraph.
Will managers see data they are not allowed to see?
No. Every request runs through your existing row-level and role-based rules on the warehouse and CRM. A regional manager cannot pull another region's margin; finance can still see the group view. We treat governance as a design requirement, not an afterthought.
Which data sources can feed the natural language report builder?
We typically ground requests in HubSpot or Salesforce for pipeline and bookings, BigQuery, Snowflake, or SQL Server warehouses for finance and ops metrics, and Power BI or Looker semantic models where those already define trusted KPIs. If the number already lives somewhere governed, we can chart and pack it.
How long does a natural language report builder take to set up?
A focused first wave covering one metric catalogue and the highest-volume board or ops packs usually takes 4–6 weeks, including two parallel cycles against the existing ticket queue. Multi-entity suites with broader export templates and deeper CRM joins sit closer to 8–10 weeks.
Will this replace our BI analysts?
No. It retires the repetitive ticket queue for standard packs so analysts spend time on models, forecasts, and novel questions. Forrester still finds roughly 80% of decision-makers rely on the 20% who can operate BI tools. The builder moves that majority onto self-service for routine requests without hiring another analyst FTE.
How much does an AI natural language report builder cost?
Focused builds for a governed metric catalogue and core board or ops packs typically start from around R45,000. Broader programmes with multi-source grounding, export libraries, and multi-entity governance usually fall between R70,000 and R140,000. Teams burning analyst capacity on three-day Excel packs usually recover the build within one or two quarters from redirected hours alone.
Stop Waiting Days for Standard Report Packs
If your managers still lodge tickets for the same board and ops packs every week, you are paying analyst capacity for a problem self-service analytics already solves.
Tell us which CRM and warehouse you run, which packs clog the backlog, and what governance rules must hold. We will show you exactly how a natural language report builder would work for your Exco and ops cadence.