AI Workflow Optimisation: Find the Bottlenecks Your Dashboards Miss
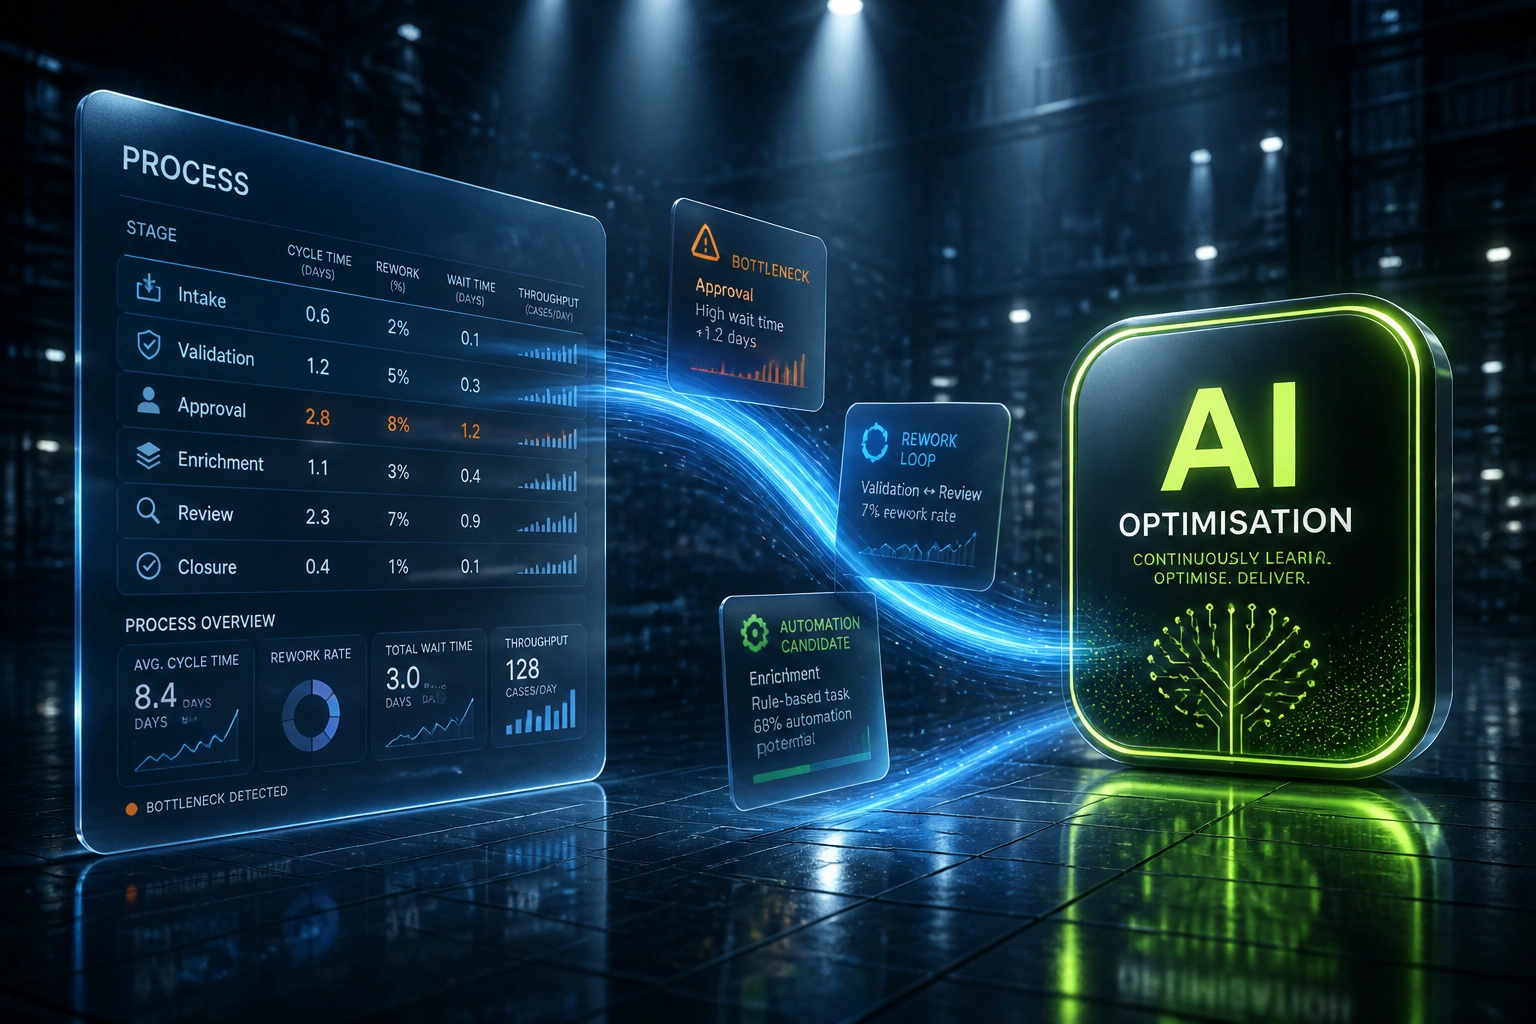
You can feel the organisation is slower than it should be. CRM stages look healthy, ERP orders eventually ship, tickets eventually close, yet cycle times keep stretching and margins keep thinning. AI workflow optimisation analyses real process data to surface bottlenecks, rework loops, and automation opportunities with quantified impact.
We connect to your systems, mine the flows, and deliver a ranked optimisation roadmap.
Sound Familiar?
These are the exact issues our clients faced before AI workflow optimisation:
- Leadership senses the business is slower than it should be, but nobody can name the bottleneck
- CRM stages, ERP order cycles, and ticket queues each tell a partial story; none show the end-to-end flow
- Rework loops and handoff delays feel "normal" because they have always been there
- Automation projects start on gut feel and miss the steps that actually burn cycle time
- Headcount freezes mean you cannot hire your way out of process drag
Margin pressure and headcount freezes leave no spare capacity for guesswork automation. Digital transformation fatigue is real: another dashboard will not fix a process you cannot see. Visibility gaps between CRM, ERP, and support systems are where cycle time and cash leak quietly.
What Process Optimisation AI Actually Delivers
Connect systems → mine event logs → rank bottlenecks → wire the fixes that earn their keep.
Connect Your Systems
CRM stages, ERP order events, ticket lifecycles, and approval chains feed the analysis
Mine the Real Flow
Business process mining rebuilds as-is paths: variants, waits, rework, and handoffs
Rank Opportunities
Bottlenecks and automation candidates scored by days and rands of impact
Optimise & Automate
Process fixes first, then selective automation where the data proves the case
Everything You Need for Workflow AI That Pays Back
Event-Log Process Mining
We connect to your CRM, ERP, helpdesk, and approval tools and rebuild how work actually flows from timestamps, not from the SOP on the wall.
Bottleneck & Wait Analysis
Stage-by-stage cycle time, queue wait, and handoff delay become visible. You see which transition is inflating every case, not just the average KPI.
Rework Loop Detection
Cases that bounce back to earlier steps are quantified: frequency, days added, and the team or field that keeps failing first-time-right.
Ranked Optimisation Roadmap
Every finding is scored by time and rand impact. You get a prioritised list of process changes and automation candidates, not a dashboard full of charts.
Automation Opportunity Scoring
Repetitive, rule-based steps with clean inputs are flagged for RPA or workflow automation. Unstable steps stay human until the process is fixed.
Optional Fix Wiring
Where the data earns it, we wire the fix: completeness gates before handoff, approval SLAs, routing rules, or selective automation into your existing stack.
Systems We've Mined for Process Insights
From 18-Day Cycles to 9-Day Cycles
How a 90-person South African distributor recovered R2.4M in year-one leakage after process mining exposed one handoff nobody owned.
The Invisible Process
- Order-to-fulfil averaged 18 days; leadership blamed "busy season"
- SOP showed 11 steps; event logs revealed 34 variants in live work
- 38% of orders bounced between sales and finance on incomplete docs
- 6.2 of those 18 days were pure queue wait, not productive work
- Automation ideas were queued without knowing which step actually mattered
The Ranked Optimisation
- Process mining ranked the sales-to-finance handoff as the top leak
- A completeness gate before handover cut bounce-backs sharply
- Two stable enrichment steps were automated; unstable reviews stayed human
- Cycle time dropped to 9 days within the first month of fixes
- Automation scope shrank by ~60% because broken steps were fixed first
Before vs After AI Workflow Optimisation
How It Works
From first conversation to ranked roadmap in 3–5 weeks for a focused process.
Tell Us Where It Drags
Which process feels slow (order-to-cash, ticket lifecycle, approvals), which systems hold the timestamps, and what "faster" would unlock.
Free Scoping Call
30-minute call to map systems, event coverage, and which workflows have enough history for a credible process mining pass.
Mine, Rank & Parallel-Review
We extract event logs, build the as-is map, and review ranked bottlenecks and automation candidates with your ops leads against live cases.
Deliver Roadmap & Optional Fixes
You leave with a scored optimisation backlog. Where impact is clear, we wire process changes and selective automation, then monitor cycle-time shift.
Frequently Asked Questions
How is AI workflow optimisation different from a BI dashboard?
A dashboard shows KPIs. Process mining reconstructs the real path every case took through your systems: variants, rework loops, wait states, and handoffs. AI workflow optimisation then ranks what to fix and what to automate. Most clients already have dashboards. They still cannot see why cycle time is stuck.
What systems do you need access to?
Wherever the process leaves timestamps: CRM stage history, ERP order events, helpdesk ticket transitions, approval logs, and warehouse or WMS status changes. We typically start with HubSpot or Salesforce, Xero or Sage, Jira or Zendesk, and any mid-market ERP that exposes audit or status history. If the event exists, we can mine it.
Will this disrupt day-to-day operations?
No. Mining is read-only against historical event data. Recommendations land as a ranked roadmap for ops and leadership to accept. We only wire process changes or automation after you choose which opportunities to act on, and we parallel-test before switching anything off.
How long does an AI workflow optimisation engagement take?
A focused single-process scan (for example order-to-cash or ticket lifecycle) with ranked opportunities usually takes 3–5 weeks. Multi-process programmes with selective automation wiring sit closer to 6–10 weeks, depending on system access and data quality.
Do we have to automate everything the analysis finds?
No. The point of process mining is to stop automating broken steps. Many of the highest-value fixes are simple: a completeness gate before handoff, a clearer approval SLA, or retiring a duplicate review. Automation is reserved for stable, high-volume steps with clean inputs.
How much does AI workflow optimisation cost?
Focused single-process mining and ranked roadmaps typically start from around R45,000. Broader builds that include multi-system event extraction and selective automation wiring usually fall between R70,000 and R140,000. Teams losing weeks of cycle time to hidden rework and handoffs often recover the engagement within one or two quarters from throughput and leakage alone.
Stop Automating Blind
If your ops team can feel the drag but cannot prove where it lives, another BI dashboard will not close the gap. Process mining and workflow AI will.
Tell us which process feels slowest, which systems hold the timestamps, and what a faster cycle would unlock. We will show you how AI workflow optimisation would rank your bottlenecks and automation opportunities.