SA Property Market Trends: Data-Driven Analysis with Apify Scraping
Property investor CEOs, agency principals, and developments heads still set pricing and stock from quarterly PDF packs. Lightstone and SAPOA research arrive late; Property24 and Private Property live in separate tabs. Apify-powered multi-portal scraping into a real estate data dashboard catches suburb momentum and asking-price shifts weeks earlier.
We build the SA property market analysis feed that keeps your trend intelligence live.
Sound Familiar?
These are the exact issues our clients faced before a multi-portal trend dashboard:
- Investment committees still price land and stock off quarterly PDF research packs that lag live asking-price moves by weeks
- Analysts click Property24 and Private Property suburb by suburb, then paste comps into spreadsheets that are stale by Monday
- Lightstone suburb reports at R138 each and Professional toolkits at R1,995 a month still leave multi-portal inventory trends in separate tabs
- SAPOA and bank house-price packs arrive on a half-yearly or monthly lag while rate cycles shift buyer affordability in weeks
- Suburb momentum, price cuts, and property-type mix never sit in one live trend dashboard for principals who decide pricing
The SARB cut the repo rate six times from late 2024 into late 2025, then hiked 25 basis points to 7% in May 2026 before holding later in the year. FNB house-price growth slowed to 5.2% y/y by June 2026 as borrowing costs weighed on demand. Inventory and asking prices shift suburb by suburb through that cycle. A quarterly PDF and a single-portal browse cannot keep pricing decisions honest.
What Multi-Portal Property Scraping Intelligence Actually Does
Watch list set → Apify scrapes both portals → trends normalise → dashboard updates. No human pasting listings into Friday spreadsheets.
Define Suburb Watch List
You name metros, suburbs, property types, and bands that drive pricing and stock decisions
Apify Scrapes Both Portals
Property24 and Private Property listings pull on a schedule into one normalised store
Trends Aggregate
Asking prices, new stock, withdrawals, and property-type mix roll up by suburb and city
Dashboard & Alerts
Principals open one trend view; momentum shifts alert before the next quarterly pack
Everything You Need for Property Scraping Intelligence Dashboards
Multi-Portal Scraping
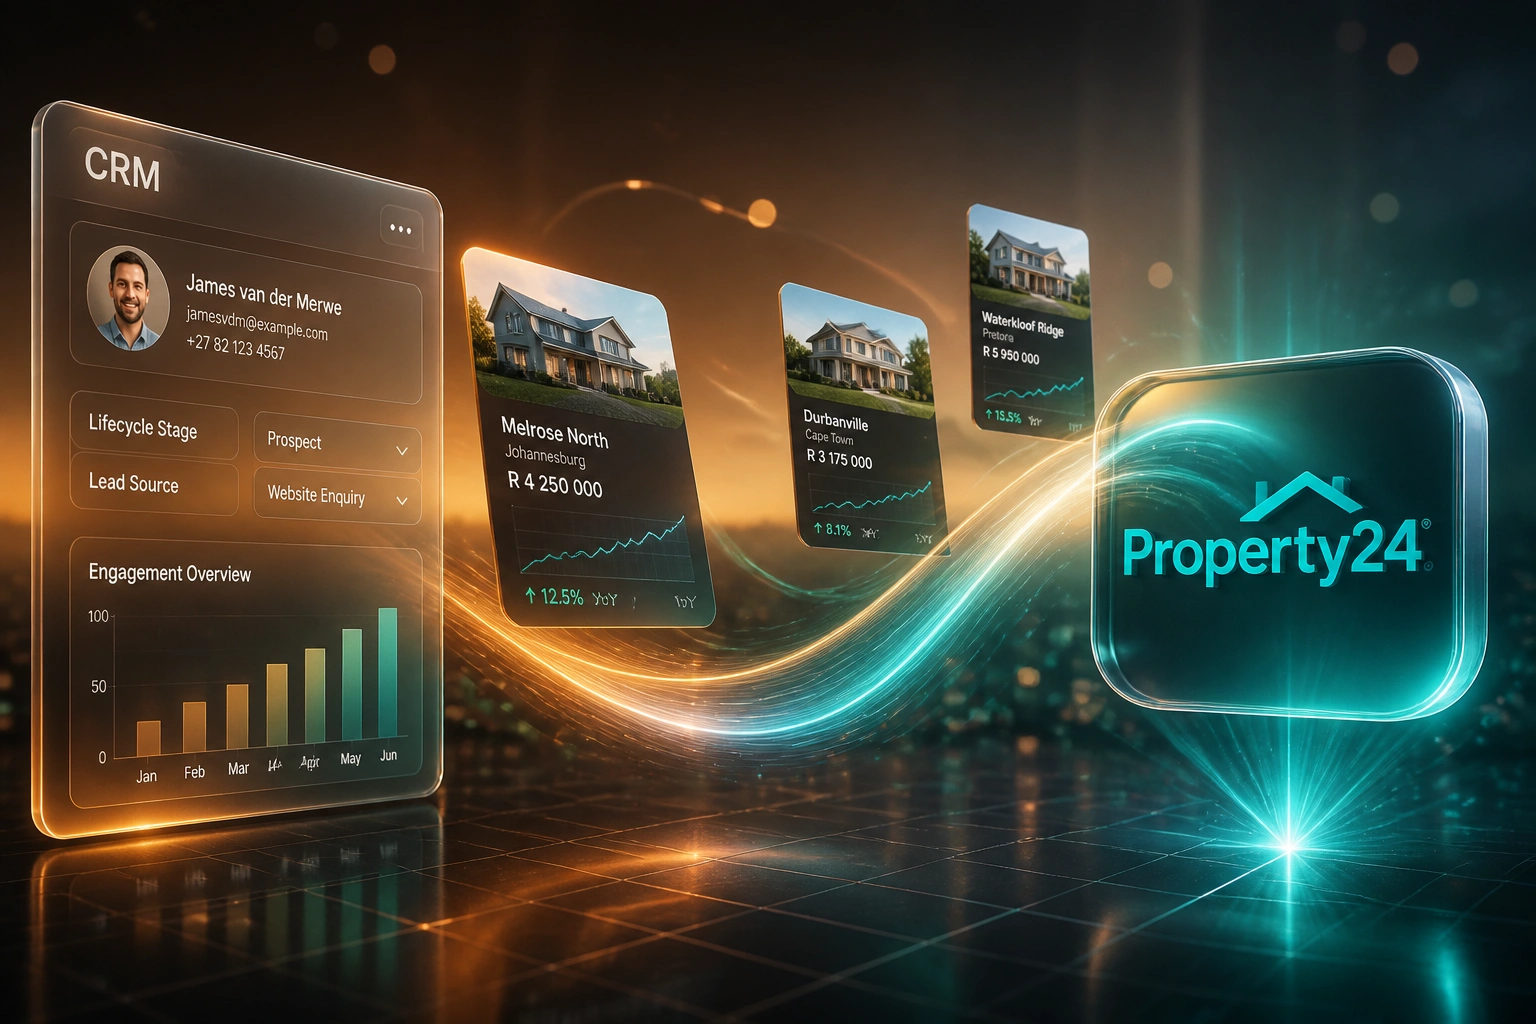
Apify Actors pull Property24, Private Property, and optional secondary portals into one normalised listing store, not three browser marathons.
Suburb & City Trend Dashboards
Asking-price medians, new stock, withdrawals, and YoY shifts chart by suburb and metro so Claremont, Umhlanga, and Sandton read side by side.
Property-Type Slices
Sectional title, freehold, apartments, and vacant land break out separately so developers and agencies stop averaging unlike stock together.
Asking-Price Momentum Alerts
Flag suburb bands where list prices move, inventory builds, or stock vanishes so principals see the turn before the next PDF pack lands.
Research Store Delivery
Feeds land in Google Sheets, BigQuery, Postgres, Power BI, or your investment CRM with suburb and property-type keys ready for models.
Scheduled Refresh Cadence
Daily or weekly Actor runs keep the dashboard current through rate moves, without another Friday portal scrape by a junior analyst.
Sources & Destinations We've Wired for Trend Dashboards
From 12 Hours/Week of PDF Comps to a Live Dashboard
How a Cape investment group stopped pricing acquisitions off stale research packs and started reading suburb asking-price momentum across both major portals.
The Manual Process
- Two analysts clicked Property24 and Private Property suburb by suburb every Friday
- Comps pasted into Excel, then summarised into a PDF pack for Monday IC
- Lightstone suburb reports bought ad hoc at R138 each when a node looked hot
- SAPOA and bank packs arrived weeks late relative to live listing behaviour
- Price cuts mid-week never reached the pack until the following cycle
The Automated Process
- Apify Actors scrape both portals on a daily cadence into one store
- Suburb and property-type dashboards refresh before the investment meeting
- Momentum alerts flag asking-price and inventory shifts in watch nodes
- Principals open Power BI instead of waiting for a quarterly PDF
- Analysts review exceptions only; no more Friday portal marathons
Before vs After Multi-Portal Trend Analysis
How It Works
From first conversation to a live multi-portal trend dashboard in 2–4 weeks.
Tell Us Your Watch List
Which metros, suburbs, property types, and price bands drive your pricing, stock, and land decisions across SA portals.
Free Scoping Call
30-minute call to size multi-portal Apify runs, dashboard slices, and delivery into Sheets, warehouse, or BI.
Build & Validate
We pilot one metro cluster, reconcile fields across Property24 and Private Property, then wire the trend dashboard.
Go Live & Monitor
Scheduled scrapes refresh the dashboard, with run monitoring and optional alerts when suburb momentum shifts.
Frequently Asked Questions
How is this different from scraping Property24 alone?
Single-portal feeds answer what is listed on Property24. This build combines Property24 with Private Property (and optional secondary portals) into suburb, city, and property-type trend dashboards. Investors and agency principals see cross-portal asking-price momentum and inventory shifts in one place, not another Property24-only listing extract.
How long do traditional SA property research packs lag the live market?
SAPOA Property Trends and Operating Costs research is typically half-yearly and member-gated, so commercial packs often describe the prior period months after the fact. Deeds-based house price indices such as FNB HPI arrive on a monthly publication lag. Seeff notes that interest-rate cuts usually take two to three months to show as visible market movement. Live multi-portal listing trends surface asking-price and stock shifts weeks earlier than those packs.
What do Lightstone and similar research tools cost versus a live dashboard?
Lightstone Residential Property Toolkit Standard is R770 a month excl. VAT (45 in-bundle reports) and Professional is R1,995 a month (210 reports). On-demand Suburb and Property reports are about R138 each excl. VAT. Those products excel at deed and valuation-style reads. They are not a continuous multi-portal asking-price and inventory trend dashboard across your suburb watch list.
How much analyst time goes into manual comps and trend packs?
Team Seven reports that SA estate agents spend roughly nine hours behind the scenes for every hour with a client, much of it on sales research and comparative market analysis. Industry surveys put a single CMA at about 45 to 90 minutes. Desks covering multiple suburbs and both major portals commonly burn 10 to 14 hours a week pasting listings into spreadsheets before a pricing decision is made.
Why combine Property24 and Private Property?
Competition Commission inquiry work placed Property24 around 60 to 68 percent of SA property portal traffic, with Private Property second at roughly 23 to 28 percent. Recent Semrush estimates put Property24 near 13 million monthly visits versus about 3 million for Private Property. Most agencies list on both. Trend intelligence that watches only one portal misses stock and price cuts that appear first on the other.
How much does a multi-portal SA property trend dashboard cost?
Pilot suburb extracts start from around R15,000. Ongoing Apify pipelines with Property24 plus Private Property normalisation, suburb and property-type dashboards, and BI delivery typically range from R25,000 to R60,000. Desks reclaiming 10+ hours a week of analyst time, or avoiding a mispriced land bid after a rate move, usually see payback within a few months.
Stop Pricing Off Stale Research Packs
If your investment or agency desk still builds suburb comps from Property24, Private Property, and quarterly PDFs by hand, you are paying for lag that competitors with live dashboards do not carry.
Tell us which metros and property types you watch, how IC packs are assembled today, and where asking-price surprises have hurt bids. We will show you how a multi-portal Apify trend dashboard would work for your desk.