Building a Financial Dashboard from CRM and Accounting Data
Every Monday you open three tabs: CRM, accounting, and the bank. Pipeline looks fine. Revenue looks fine. Cash still surprises you by Wednesday. Executive reporting should not be a scavenger hunt.
We build one live view that joins pipeline, recognised revenue, and cash so leadership acts on facts.
Sound Familiar?
These are the Monday mornings our clients described before they had a live financial dashboard:
- You open the CRM, Xero, and the bank every Monday and still cannot answer "are we actually making money?"
- Pipeline looks strong while cash is tight, and nobody can see both numbers in the same view
- Board and exec packs take days to assemble from exports, screenshots, and spreadsheet glue
- Forecasts miss because sales commits on CRM stages that finance never sees as invoices or cash
- Hiring, stock, and marketing spend decisions wait on last week's numbers while the market moves
Finance teams still spend just over half their week on manual work, and CEOs routinely burn 8–12 hours assembling board and exec packs from disconnected systems. That is decision speed you are paying for twice: once in salary, and again in late calls on hiring, cash, and growth.
What the Financial Dashboard Actually Shows
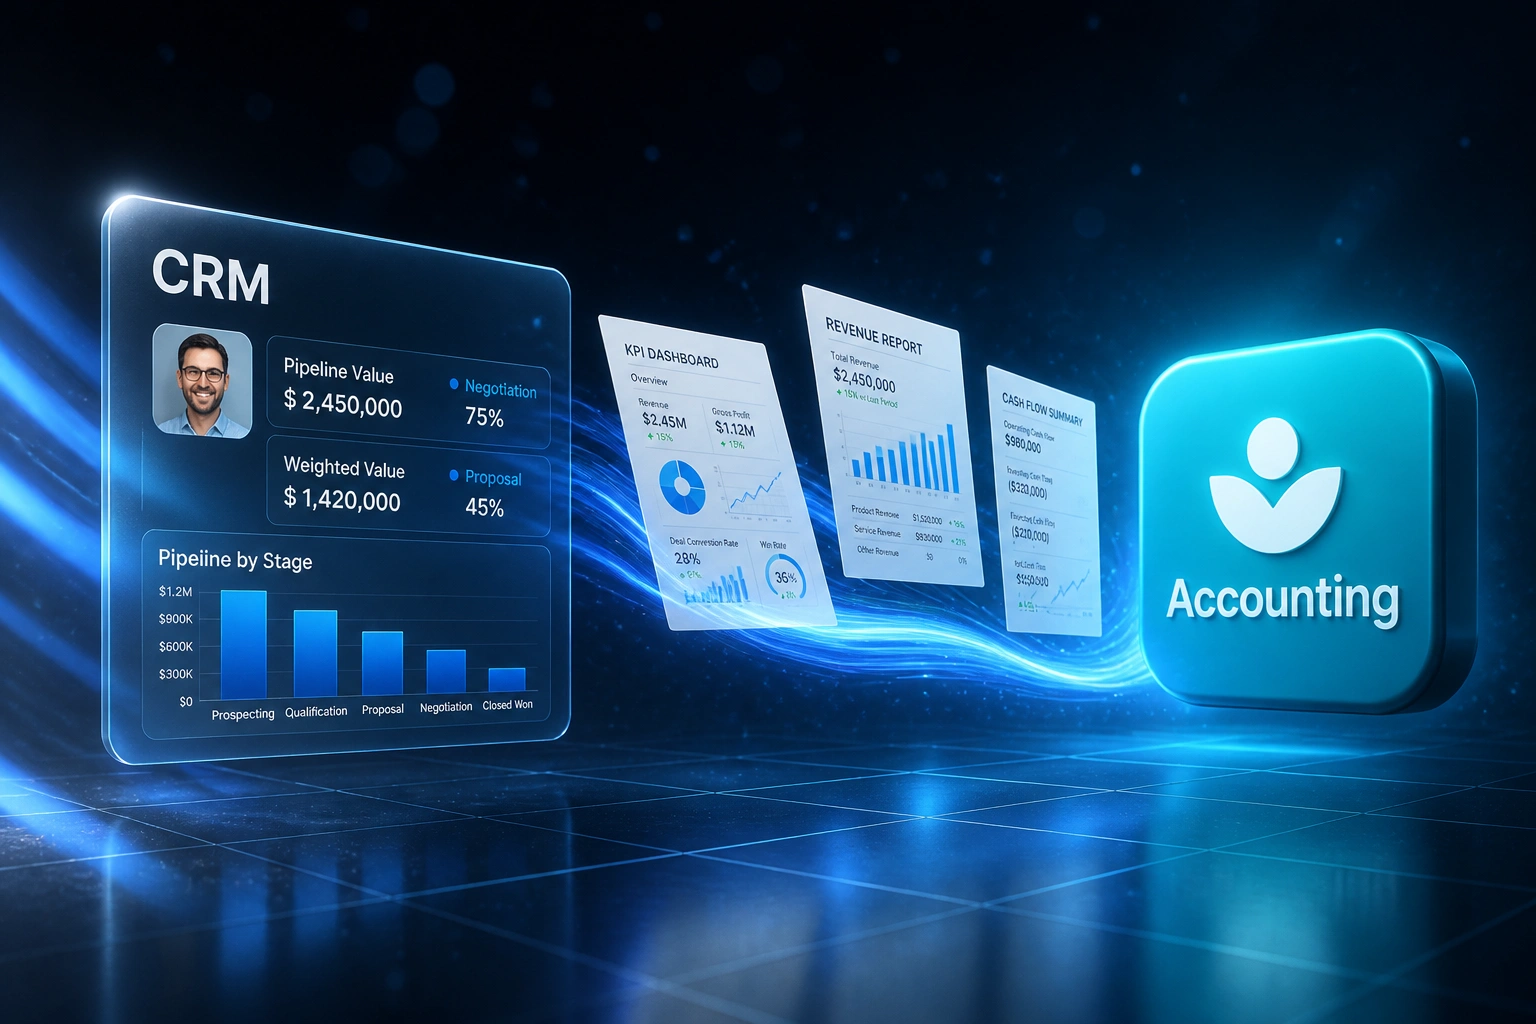
CRM analytics and accounting actuals land in one live view. Leadership opens facts, not three browser tabs.
CRM Pipeline Feeds In
Weighted pipeline, stage values, and closed-won commitments sync from your CRM
Accounting Actuals Join
Invoiced revenue, cash collected, and aged debtors pull from Xero, Sage, or QuickBooks
One Live Revenue View
Pipeline sits next to recognised revenue and cash so gaps are visible the same morning
Leadership Acts Faster
Hiring, spend, and cash calls happen on current numbers, not last week's spreadsheet
Everything You Need for Trusted Executive Reporting
Live Pipeline vs Revenue
Weighted CRM pipeline sits next to invoiced and recognised revenue from accounting, so leadership sees commitment and reality in one frame.
Cash Collected & Runway
Payments applied in Xero, Sage, or QuickBooks update the dashboard in near real time, so cash position is never a Wednesday surprise.
Aged Debtors Overlay
Overdue receivables from the ledger sit beside open pipeline, so you know whether growth is cash or just paper.
Executive KPI Pack
A single always-on view for the CEO, MD, and CFO: pipeline, bookings, recognised revenue, cash, DSO, and variance to forecast.
CRM & Ledger Sync Layer
Deals, invoices, credit notes, and payment statuses stay aligned underneath the dashboard so the numbers never drift apart.
Role-Based Access
Leadership sees the full financial dashboard. Sales and ops get the slices they need, without exporting sensitive ledger detail.
Systems We've Connected for Revenue Dashboards
From 8 Hours of Tab-Switching to a 20-Minute Review
How a 35-person professional services firm gave its MD and CFO one live view of pipeline, revenue, and cash.
The Monday Scramble
- MD exported HubSpot pipeline, CFO pulled Xero P&L and aged receivables, ops pasted bank balances into Excel
- Eight hours a week assembling the executive pack before leadership could discuss the numbers
- Pipeline often looked R3–4M healthy while cash and debtors told a tighter story two days later
- Quarterly forecasts missed by roughly ±18% because CRM stages never met invoiced and collected actuals
- Hiring and marketing spend waited on "once the pack is ready"
The Live Financial Dashboard
- One custom dashboard pulls HubSpot pipeline beside Xero revenue, cash applied, and aged debtors
- MD and CFO open the same morning view; the Monday pack is a 20-minute review, not a rebuild
- Pipeline vs recognised revenue vs cash is visible before the leadership call starts
- Forecast variance tightened as CRM analytics and accounting actuals shared one definition of progress
- A same-week hiring decision ran off live cash and weighted pipeline, not last Thursday's export
Before vs After the Live Dashboard
How It Works
From first conversation to a live executive dashboard in 3–6 weeks.
Tell Us Your Setup
Which CRM, which accounting stack, and which Monday questions you still answer by tab-switching.
Free Scoping Call
30-minute call to map the KPIs that matter, the data sources, and whether this is a dashboard build, an integration layer, or both.
Build & Test
We connect CRM and accounting APIs, build the live financial dashboard, and run it in parallel with your Monday pack for two weeks.
Go Live & Monitor
Switch the exec pack to the live view. Monitoring keeps the sync healthy so leadership always opens a trusted number.
Frequently Asked Questions
How is this different from month-end CRM and accounting reconciliation?
Reconciliation explains why closed CRM revenue and the P&L disagree after the period closes. This financial dashboard is always on: pipeline, recognised revenue, cash collected, and aged debtors in one live view so the CEO and CFO can act during the week, not only at month-end.
Which systems can feed the executive reporting dashboard?
We typically pull pipeline and deals from HubSpot, Pipedrive, Salesforce, Zoho CRM, or Monday.com, and revenue, cash, and debtors from Xero, Sage, QuickBooks, Zoho Books, or NetSuite. The front end can be a custom app, Power BI, or Looker Studio, depending on how your leadership prefers to work.
Is this a custom app or an off-the-shelf BI tool?
Both paths work. Many clients want a tailored executive dashboard under our app development service so the Monday view matches how they actually run the business. Others prefer Power BI or Looker Studio on top of a clean CRM-to-accounting data layer. We recommend the lightest option that still answers the money question every morning.
How long does a CRM analytics and revenue dashboard project take?
Most mid-market builds take 3–6 weeks from scoping to go-live, including two weeks of parallel running against your existing Monday pack. A focused single-entity dashboard with one CRM and one ledger can be live sooner. Multi-entity or multi-currency groups sit closer to 6–8 weeks.
Will finance still own the books?
Yes. The dashboard reads from your CRM and accounting systems. It does not replace your ledger or your month-end judgment. What disappears is the hours spent copying exports into slides before every leadership meeting.
How much does a CRM and accounting financial dashboard cost?
Focused live dashboards typically start from around R40,000. Broader executive reporting builds with multi-entity cash, aged debtors, and forecast variance usually fall between R55,000 and R95,000. Teams spending a full day a week assembling packs usually recover the build cost within one or two quarters of leadership time alone.
Stop Guessing Whether You Are Making Money
If your leadership still assembles pipeline, revenue, and cash from three systems every week, you are paying for delayed decisions.
Tell us which CRM and accounting stack you run, and which Monday questions still need a spreadsheet. We will show you how a live financial dashboard would look for your business, as a custom build or on the BI tool you already trust.