CRM Deal Tracking: From Lead to Closed-Won with Forecasting You Can Trust
You leave Friday's forecast meeting unsure whether the number is real. Pipeline analytics without stage velocity, ageing, and bottleneck signals turns commit into theatre, and the board feels it every quarter.
We build deal tracking that makes weighted forecasts and commit accuracy measurable.
Sound Familiar?
These are the exact issues our clients faced before proper deal tracking:
- Friday forecast meetings become interrogation sessions where leadership cannot tell which deals are real
- Weighted pipeline looks healthy while stage-aged deals and zombies inflate the number by 15–35%
- Managers spend four-plus hours a week scrubbing CRM fields instead of coaching buyers
- Commit numbers swing ±15–25% every quarter, so hiring and cash planning rest on guesswork
- HubSpot and Salesforce forecast views still leave you flying blind without velocity and bottleneck signals
Only 46% of deals forecasted to close actually close in-period (Gartner). Native CRM forecasting without velocity, ageing, and bottleneck tracking still leaves sales directors flying blind on commit.
What Deal Tracking and Pipeline Analytics Actually Do
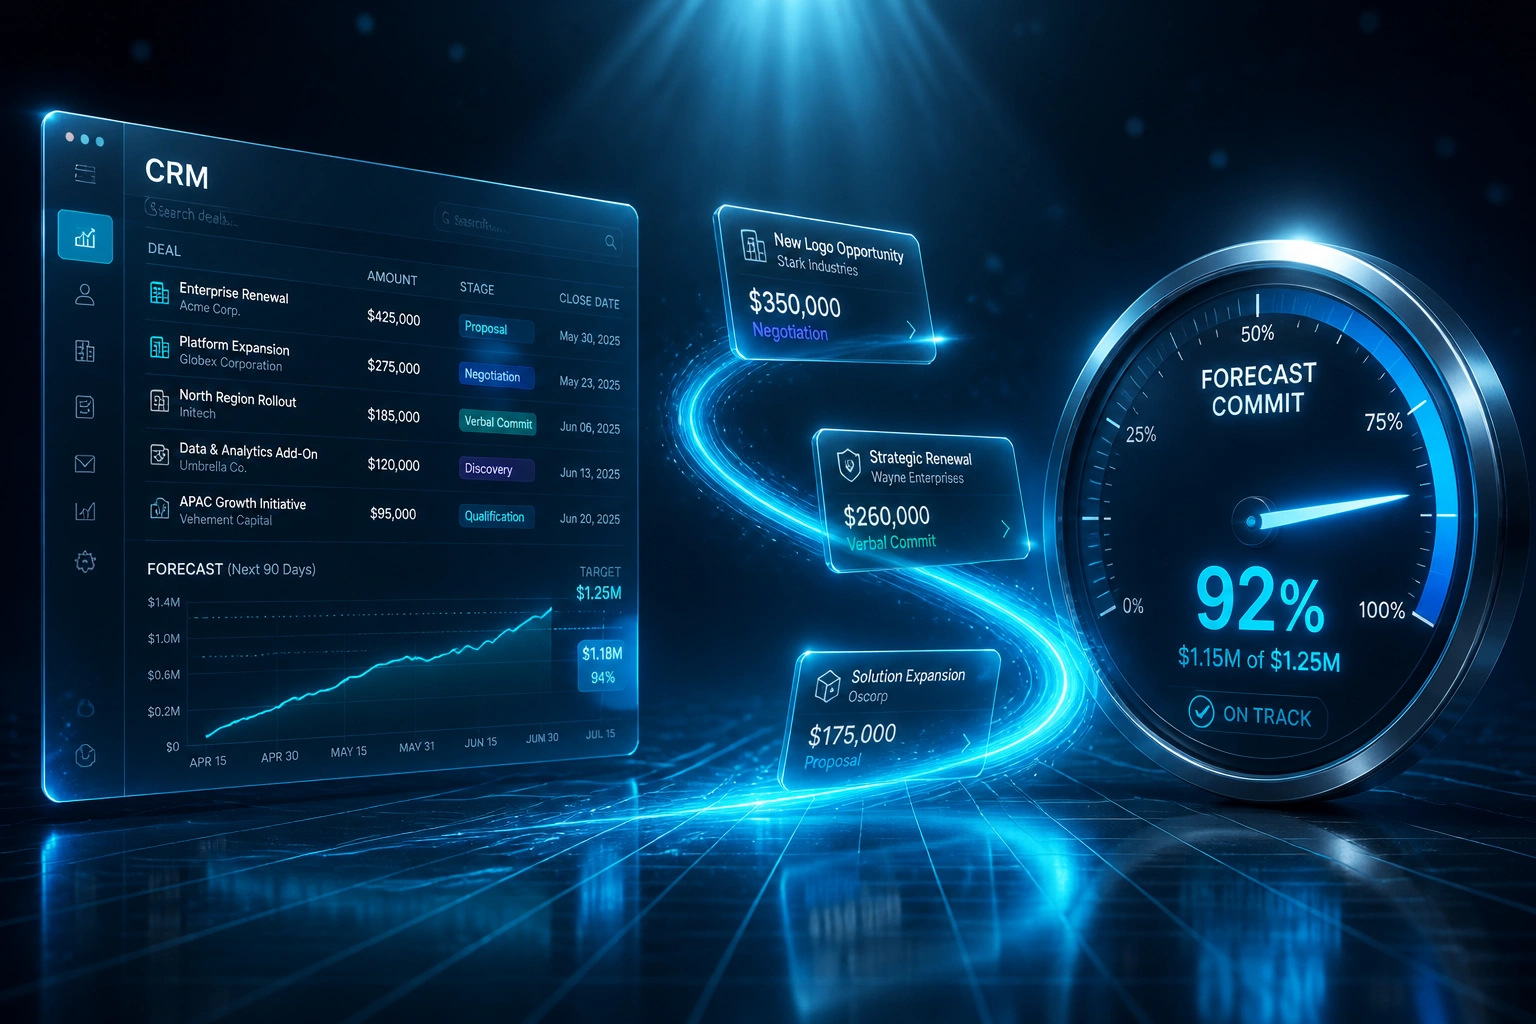
Deal moves → velocity scored → bottleneck flagged → commit updates. No Friday spreadsheet archaeology.
Deal Activity Lands in CRM
Stage changes, next steps, and close dates update in HubSpot, Salesforce, or your CRM
Weighted Forecast Recalculates
Stage probability × deal value rolls into commit, best case, and pipeline views
Velocity and Ageing Flag Risk
Deals past dwell thresholds or inactive windows hit manager alert queues
Commit You Can Defend
Friday's number rests on evidence, not optimism or sandbagging
Everything You Need for Reliable CRM Reporting
Weighted Pipeline Forecasts
We calibrate stage probabilities to your historical win rates, so weighted pipeline and commit stop overstating what will actually close.
Stage Velocity Metrics
Days-in-stage against your closed-won baselines. Deals that sit 1.5× longer than normal surface before they poison the board pack.
Bottleneck Heatmaps
Conversion and dwell heatmaps show where deals stall by stage, segment, and owner, so managers coach the real constraint.
Commit Accuracy Cadence
Commit, best case, and pipeline categories map to evidence and ageing rules, so Friday's number matches Monday's reality.
Stale Deal and Hygiene Alerts
Inactivity windows, past close dates, and missing next steps route to manager queues before zombie deals inflate coverage.
Manager Forecast Views
Board-ready roll-ups and deal-level risk lists replace spreadsheet theatre, so review time goes to decisions, not data cleanup.
CRMs We've Configured for Deal Tracking
From ±18% Miss to ±6% Commit
How a mid-market B2B sales team stopped Friday forecast theatre and recovered R1.2 million in year one.
The Manual Scrub
- Two sales managers spent 4.5 hours each week re-interrogating late-stage deals
- Weighted pipeline used default CRM percentages that overstated commit
- 15–30% of open deals were stage-aged zombies with no activity
- Quarterly forecast swung ±18%, forcing reactive hiring and cash decisions
- Board packs required a weekend of spreadsheet reconciliation
Tracked and Forecasted
- Calibrated weighted forecasts plus stage velocity and ageing alerts
- Bottleneck heatmaps showed where deals stalled by stage and owner
- Managers review exceptions in under two hours a week combined
- Quarterly commit landed within ±6% for three consecutive quarters
- Friday meetings coach risk deals instead of rebuilding the number
Before vs After Deal Tracking
How It Works
From first conversation to a live commit cadence in 3–6 weeks.
Audit the Forecast Gap
We measure your current miss rate, stage dwell, CRM field completeness, and how many hours managers burn scrubbing.
Design Tracking and Commit Rules
Weighted probabilities, velocity thresholds, bottleneck views, and commit categories grounded in your closed history.
Build Dashboards and Alerts
We configure CRM reports, forecasts, and hygiene alerts, then pilot with one team through a full forecast cycle.
Calibrate and Hand Over
After the first live quarter, we retune probabilities and ageing rules, then leave managers with a weekly cadence that sticks.
Frequently Asked Questions
What is CRM deal tracking, and how is it different from pipeline design?
Pipeline design sets the stages and exit criteria. Deal tracking is what happens once that pipeline exists: weighted forecasts, stage velocity, stage ageing, bottleneck heatmaps, and commit accuracy. We assume your stages are workable, then make the number that leaves Friday's meeting reliable.
We already use HubSpot or Salesforce forecasting. Why do we still miss commit?
Native forecast views are only as good as stage probabilities, data hygiene, and velocity signals. Default percentages, stale deals, and irregular reviews routinely leave teams in the ±15–25% miss band. We add calibrated weighting, ageing alerts, and bottleneck views so the platform stops lying about commit.
How accurate can our sales forecasting get?
Industry benchmarks put elite teams at ±5–10% quarterly variance, while the median sits around ±15–25%. Only about 7% of organisations hit 90%+ accuracy. Teams that track pipeline velocity weekly often land near 87% accuracy versus about 52% for irregular review. We design for that weekly cadence and your historical win rates.
Will this disrupt our sales managers and reps?
No. We pilot with one team, keep existing CRM workflows, and replace scrubbing with exception-based alerts. Most managers reclaim several hours a week because the dashboard already flags ageing deals and missing fields before the forecast call.
Which CRMs can you set up for deal tracking and forecasting?
We have built deal tracking and forecast views in HubSpot, Pipedrive, Salesforce, Zoho CRM, Monday.com, Freshsales, and custom-built CRMs. The craft is metrics, hygiene rules, and commit cadence. The platform is secondary.
How much does CRM deal tracking and forecasting cost in South Africa?
Focused deal tracking with weighted forecasts, velocity metrics, and manager dashboards typically starts from around R40,000. Multi-team rollouts with bottleneck heatmaps, hygiene automation, and commit calibration usually fall between R60,000 and R95,000. Teams burning several manager hours a week on forecast scrubbing usually recover the build cost inside one or two quarters.
Stop Flying Blind on Pipeline Value
If your sales directors leave forecast meetings unsure whether the number is real, you are paying for theatre instead of deal tracking.
Tell us which CRM you use, how far your last few commits missed, and how many hours managers burn scrubbing. We will show you what weighted forecasts, stage velocity, and bottleneck views would look like for your team.