CRM Sales Reporting Dashboard: Kill the Monday Excel Ritual
You open HubSpot or Salesforce, export the pipeline, and spend Monday morning rebuilding coverage, ageing, and rep performance in Excel because native reports feel awkward or incomplete. By the time the pack lands, half the deals have moved.
We build the live sales dashboard that answers coverage, conversion, and quota attainment without the dump to spreadsheet.
Sound Familiar?
These are the exact Monday-morning patterns our sales-manager clients described:
- Monday mornings vanish into CRM exports, VLOOKUP cleanup, and a pipeline pack that is already stale by standup
- Forecast vs quota lives in a separate spreadsheet nobody trusts after the third manual paste
- Rep scorecards are debated in Slack because each manager built their own version of "attainment"
- Coverage, stage ageing, and conversion only surface when someone has time to rebuild the pivot tables
- HubSpot and Salesforce native reports hit row caps or awkward exports, so Excel stays the source of truth
Excel is still the source of truth for many sales teams, even when HubSpot or Salesforce is paid for. Spreadsheet-based forecasts top out around 68–70% accuracy, while live CRM-linked stacks reach the mid-80s. Stale Monday packs and remote teams without a shared live view make that gap expensive.
What the Sales Dashboard Actually Surfaces
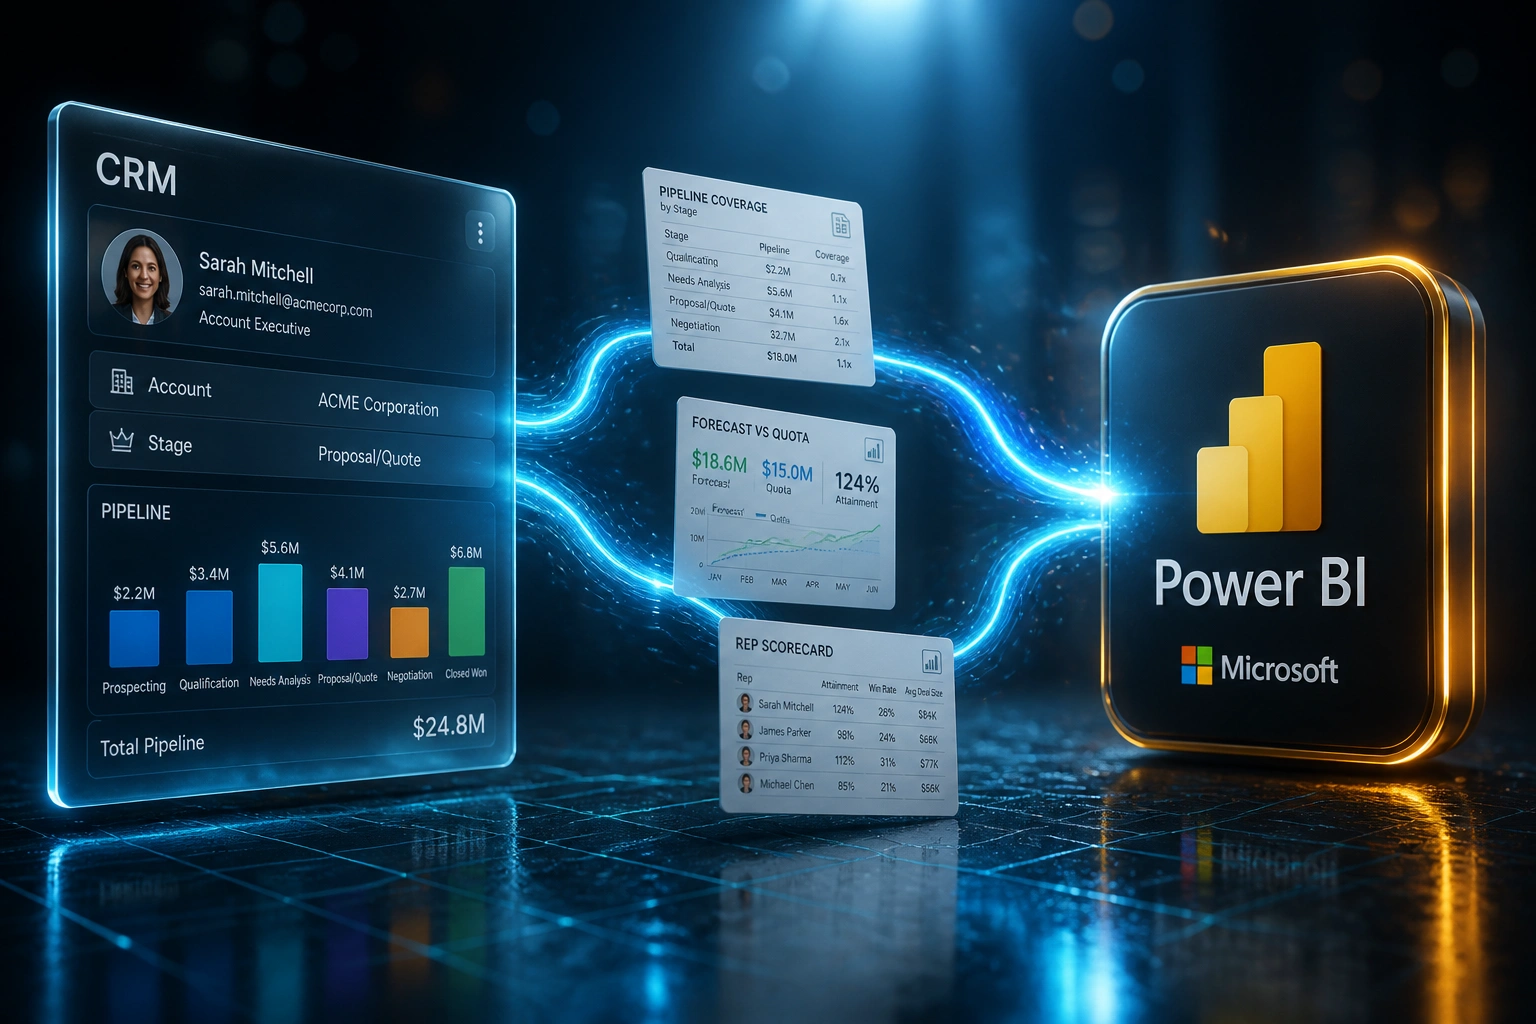
CRM updates → live pipeline and scorecards → forecast call ready. No Monday export ritual.
Deals Move in CRM
Reps update stages, amounts, and close dates in HubSpot, Salesforce, or your CRM as usual
Pipeline Board Refreshes
Coverage, stage ageing, and conversion recalculate from live fields, not last Friday's CSV
Forecast vs Quota
Commit and pipeline-weighted views land against quota by team and rep before the call starts
Rep Scorecards Ready
Managers walk into 1:1s with attainment, win rate, and deal size already on one screen
Pipeline Reporting Built for Frontline Sales Management
Live Pipeline Coverage
Coverage ratio, stage mix, and deal velocity on one board so you see thin pipeline before the weekly forecast call, not after.
Stage Ageing & Conversion
How long deals sit in each stage, where conversion drops, and which opportunities need a manager intervention this week.
Forecast vs Quota
Commit, best case, and pipeline-weighted views against quota by team and rep. One number the room can argue from.
Rep Performance Scorecards
Activity, win rate, average deal size, and quota attainment for coaching 1:1s. Managers coach people, not pivot tables.
Monday Pack on Autopilot
Scheduled digests and filters for region, product, and owner so the weekly sales rhythm starts with answers, not CSV cleanup.
Freshness Alerts
Stale-deal warnings and threshold alerts when coverage dips or ageing spikes, so remote teams share one live view.
CRMs We've Built Sales Dashboards On
From 4.6 Hours on Monday to Under 20 Minutes
How a 12-rep B2B sales team retired the weekly Excel pipeline pack and put forecast vs quota on a live CRM sales reporting dashboard.
The Monday Export Ritual
- Head of sales exported HubSpot deals every Monday and rebuilt coverage in Excel
- Forecast vs quota lived in a separate workbook pasted from three filtered reports
- Rep scorecards disagreed with the pipeline sheet, so 1:1s started with arguing numbers
- Remote managers worked off email PDFs that were already 24–48 hours behind
- Salesforce row caps on a prior instance had trained the team to trust CSV, not dashboards
The Live Manager Dashboard
- Pipeline coverage, stage ageing, and conversion refresh from CRM fields in real time
- Forecast vs quota opens before the call with commit and weighted views by team
- Rep scorecards share one definition of attainment, win rate, and average deal size
- Remote managers coach from the same live board, not last week's PDF
- Monday mornings start with stuck deals and thin coverage, not CSV cleanup
Before vs After Pipeline Reporting
How It Works
From first conversation to live sales dashboards in 2–4 weeks.
Map Your Monday Ritual
Which exports, scorecards, and forecast tabs you rebuild every week, and which questions they are meant to answer.
Define Manager Dashboards
We lock coverage, ageing, conversion, forecast vs quota, and rep scorecards to the decisions you make in 1:1s and forecast calls.
Build and Parallel-Run
Live CRM sales reporting against your current Excel pack for a week so numbers match before anyone retires the spreadsheet.
Go Live and Kill the Export
Train managers, switch off the Monday rebuild, and keep a light freshness check so the dashboard stays the source of truth.
Frequently Asked Questions
How is a CRM sales reporting dashboard different from native HubSpot or Salesforce reports?
Native reports are a start, but growing teams hit Salesforce's 2,000-row report and API caps, awkward HubSpot exports, and missing manager views for coverage, ageing, and forecast vs quota. We build a live sales dashboard layer that answers those questions without a weekly dump to Excel.
Will this replace our Monday Excel pipeline and rep pack?
That is the goal. We design around the exact cuts your sales managers already rebuild, validate live numbers against the spreadsheet for a week, then retire the manual pack once the team trusts coverage, conversion, and quota attainment on screen.
Which CRMs can you build sales reporting dashboards on?
We have built CRM sales reporting dashboards on HubSpot, Pipedrive, Salesforce, Zoho CRM, Monday.com, Freshsales, and custom CRMs. When native reporting is too limited, we connect the CRM to Power BI, Looker, Metabase, or Tableau, or embed the views in a portal your managers already open.
How do you handle Salesforce and HubSpot reporting limits?
Salesforce report viewers and many dashboard feeds cap at 2,000 rows, which pushes teams into CSV exports that are 24–48 hours stale by the time leadership reads them. HubSpot often ends in CSV or static PDF rather than a living manager board. We design around those limits with filtered live views for day-to-day coaching, and a proper analytics model when volume demands it.
How long does a CRM sales dashboard project take?
A focused manager pack (pipeline coverage, ageing, conversion, forecast vs quota, and rep scorecards) typically takes 2–4 weeks from scoping to go-live. Broader multi-region scorecards with scheduled digests usually sit closer to 4–6 weeks.
How much does a CRM sales reporting dashboard cost in South Africa?
Focused sales manager dashboard packs start from around R35,000. Multi-team scorecards with forecast vs quota, ageing alerts, and scheduled digests typically range from R55,000 to R95,000. Managers spending 4–5 hours a week on Excel packs usually recover the build cost inside one or two quarters from hours recovered alone.
Stop Rebuilding Pipeline Reporting in Excel
If Monday mornings still start with a CRM export and a forecast spreadsheet, you are spending manager time on a problem that live CRM sales reporting already solves.
Tell us which CRM you run, how your weekly forecast and 1:1 rhythm works, and which scorecards still live in Excel. We will show you exactly how a live pipeline dashboard would look for your team.