Cross-Sell Recommendation Engine: Boost Average Order Value
Static "customers also bought" widgets and hand-curated bestsellers leave money on every order. A proper recommendation engine that pairs complementary products from purchase history and customer segments lifts average order value where it counts: on the product page, in the cart, and at checkout.
We build the on-site cross-sell engine that makes every visit worth more.
Sound Familiar?
These are the exact issues our ecommerce clients faced before recommendation automation:
- Static "customers also bought" widgets show the same SKUs to every shopper, regardless of purchase history
- Merchandising spends 6–8 hours a week hand-curating bestsellers that go stale within days
- Cart and checkout never surface complementary products at the moment of highest intent
- Homepage modules push featured collections instead of segment-aware product recommendations
- Paid acquisition costs keep rising while average order value sits flat because on-site cross-sell is left to chance
Paid acquisition is getting more expensive while retargeting gets weaker. DTC CAC rose roughly 40–60% from 2023 to 2025, and privacy changes leave 15–30% of conversions harder to retarget. Every rand of traffic that already reaches your site has to work harder, which makes on-site average order value the lever you still control.
What the Recommendation Engine Actually Does
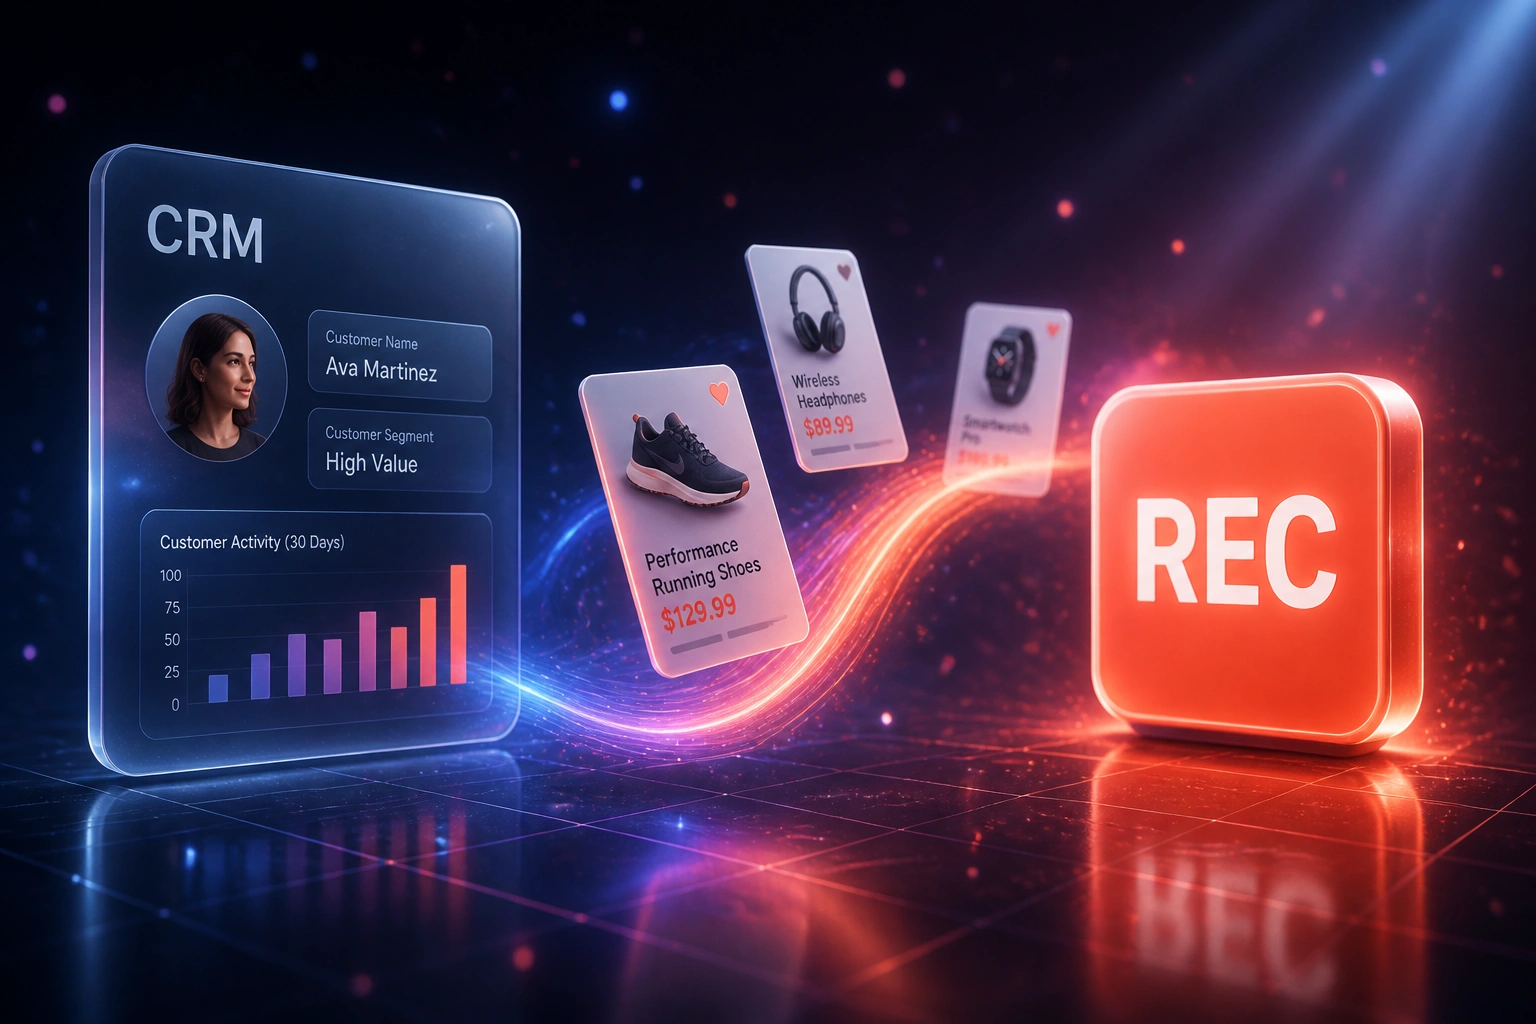
Shopper browses or buys → complementary products ranked from purchase history and segments → attach rate and AOV rise on the same visit.
Signal Captured
View, cart, and order events feed purchase history and customer segment affinity in real time
Complements Ranked
Engine pairs complementary products, filters stock and margin rules, and ranks by segment
Served On-Site
PDP, cart, checkout, and homepage modules update without a merchandiser editing each block
AOV Measured
Attach rate and average order value lift are tracked by placement against a holdout group
Everything You Need for Recommendation Automation
Purchase-History Pairing
The engine pairs complementary products from real order history, not category tags alone, so recommendations reflect what buyers actually add together.
PDP & Cart Modules
Frequently-bought-together and cart cross-sell slots lift attach rate where intent is highest: product pages, cart drawer, and checkout.
Segment-Aware Ranking
VIP, first-time, and category-affinity segments see different recommendation sets so a high-value buyer is not offered the same entry SKU as a browser.
Inventory-Aware Serving
Out-of-stock items, margin floors, and excluded collections are filtered in real time so the storefront never recommends what you cannot fulfil.
Homepage & Collection Slots
Homepage and collection modules refresh from browse and purchase signals instead of a static bestsellers carousel that ignores the shopper in front of you.
AOV & Attach Dashboards
Track average order value lift, complementary product attach rate, and recommendation-attributed revenue by placement so merchandising knows what to tune.
Platforms We've Wired for Product Recommendations
From R850 AOV to R1,090 AOV
How a South African homewares retailer replaced static widgets with a purchase-history recommendation engine and recovered R1.4 million in year one.
The Manual Merchandising Process
- Homepage and PDP showed the same hand-picked bestsellers to every visitor
- Merchandising spent 7 hours a week refreshing "customers also bought" rules
- Cart cross-sell click-through sat at 4% because complements were rarely relevant
- Average order value stuck around R850 despite rising paid traffic costs
- No reliable link between purchase history, segments, and on-site modules
The Recommendation Engine
- PDP, cart, and homepage modules rank complementary products from order history
- VIP and first-time segments see different recommendation sets automatically
- Cart attach rate rose to 17% as true complements replaced generic bestsellers
- Holdout test showed a 28% average order value lift versus static widgets
- Merchandising reviews exceptions and margin floors, not every product block
Before vs After Recommendation Automation
How It Works
From first conversation to live recommendation modules in 2–4 weeks.
Tell Us Your Storefront
Which platform, where recommendations live today, and which complementary pairs already sell well by hand.
Free Scoping Call
30-minute call to map PDP, cart, checkout, and homepage slots, plus the purchase-history and segment signals you already have.
Build & Test
We wire the recommendation engine, seed pairing rules from order history, and A/B test against your static widgets with a holdout group.
Go Live & Monitor
Modules go live with AOV and attach dashboards. We tune ranking and suppressions as your catalogue and seasons change.
Frequently Asked Questions
How is this different from post-purchase cross-sell emails?
Email flows recommend products days after the order. A cross-sell recommendation engine works on-site in real time: PDP, cart, checkout, and homepage modules that suggest complementary products while the shopper is still buying. Same goal of lifting average order value, different surface and timing.
Which platforms can power the recommendation engine?
We most often wire Shopify or WooCommerce catalogues into Nosto, Dynamic Yield, Recombee, or a custom ranking layer on your existing stack. If your storefront exposes product, order, and inventory APIs, we can drive the same purchase-history and segment logic.
Will this replace our merchandising team?
No. Merchandising still sets brand rules, hero collections, and margin floors. The engine removes hours of hand-curating "customers also bought" lists and keeps complementary product suggestions current as stock and seasons change. Your team reviews exceptions, not every widget by hand.
How do you measure whether recommendations actually lift AOV?
We run a holdout or A/B test against your current static widgets and measure average order value, complementary product attach rate, and recommendation-attributed revenue by placement. Click-attributed revenue alone can overstate impact, so incrementality is part of the go-live plan.
How long does a recommendation engine setup take?
A focused Shopify PDP and cart rollout is typically live in 2–4 weeks. Multi-placement setups with segment ranking, inventory filters, and holdout testing usually take 4–6 weeks, including parallel validation against your current merchandising rules.
How much does a cross-sell recommendation engine cost?
Focused PDP and cart recommendation modules start from around R20,000. Full engines covering homepage, PDP, cart, and checkout with segment logic and dashboards typically range from R35,000 to R75,000. Most retailers recovering even a few points of AOV see payback within 1–3 months against rising paid acquisition costs.
Stop Leaving Money on Every Order
If your storefront still shows the same bestsellers to every shopper, you are paying rising acquisition costs for traffic that never sees the complementary products it would buy.
Tell us which storefront you run, where product recommendations live today, and what your current average order value looks like. We will show you how a purchase-history recommendation engine would work on your PDP, cart, and homepage.