Customer Health Score Dashboard: Visualise Account Risk in Real Time
Your CS team still judges account risk from gut feel, lagging NPS, or five disconnected tools. By the time Monday's portfolio review is finished, the early-warning window has already narrowed.
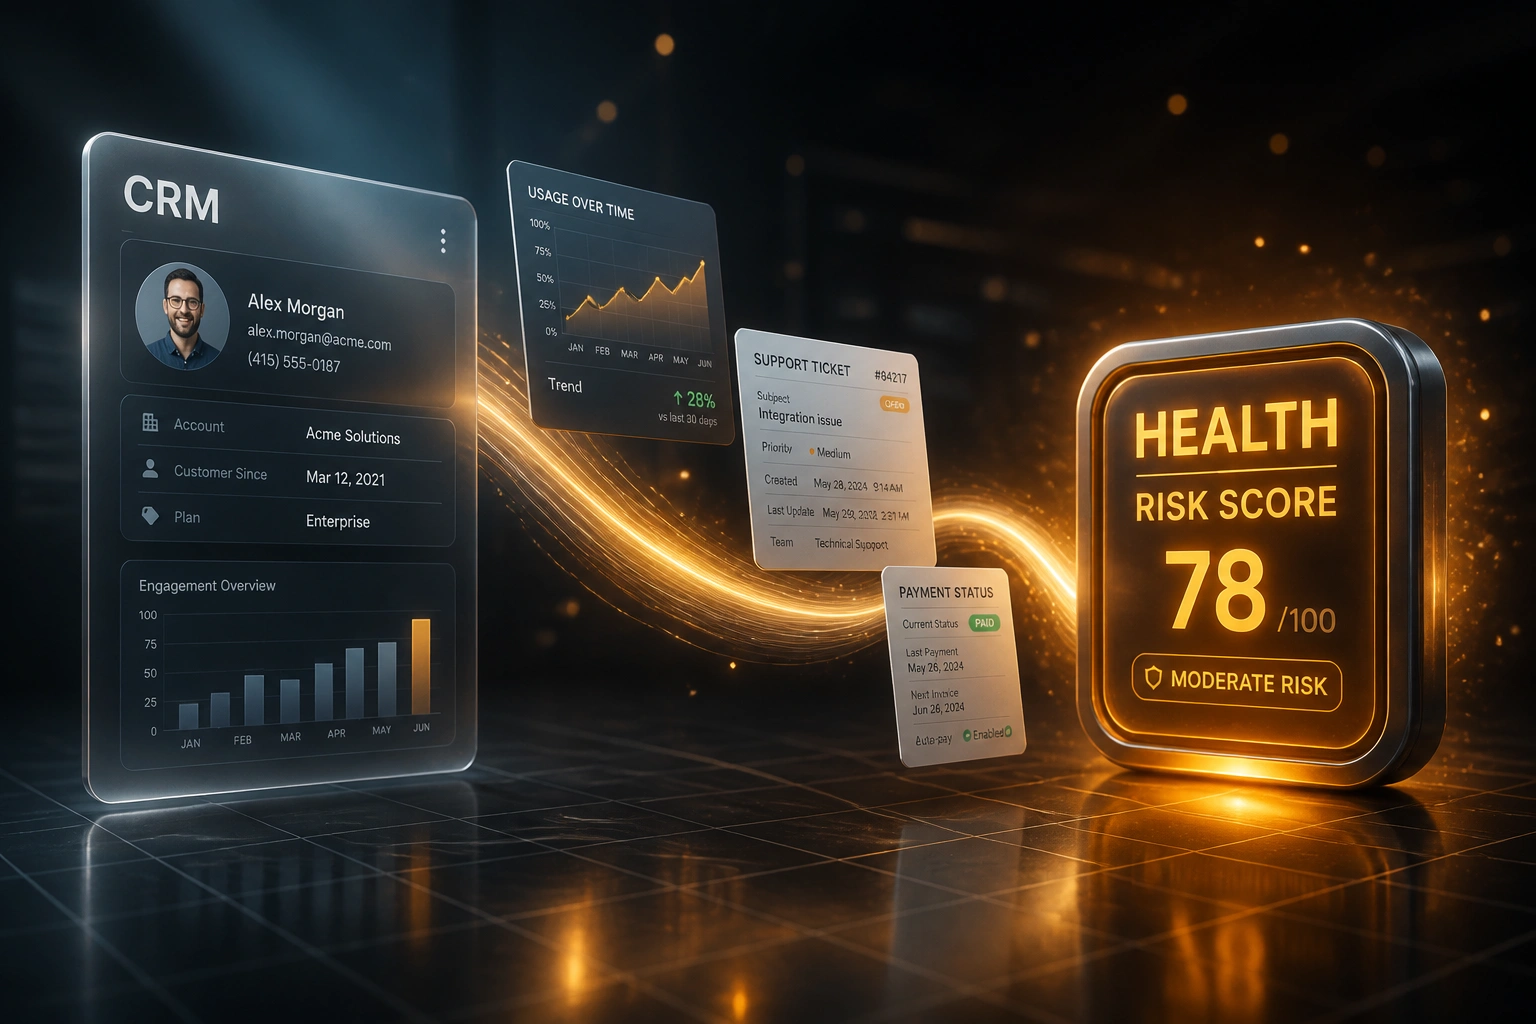
We build the health dashboard that turns usage, support, payment, and engagement into one actionable view.
Sound Familiar?
These are the exact issues CS directors bring us before a health dashboard goes live:
- Monday portfolio reviews still start in five tabs: product analytics, helpdesk, billing, email, and a stale spreadsheet
- CSMs judge account risk from gut feel, last quarter's NPS, or whoever shouted loudest in Slack
- Payment delinquency, usage drops, and support heat never sit on one screen, so silent churn stays invisible until renewal week
- Traffic-light colours exist in the CRM, but nobody trusts them because the data behind them is days or weeks old
- At-risk accounts surface as logo surprises, not as filterable lists with owners, alerts, and a clear next action
Manual reviews typically catch risk 11 days before cancellation; automated health monitoring surfaces it around 63 days out (Gainsight 2025). That 52-day gap is the difference between a 44% save rate and an 18% scramble at renewal.
What the Health Dashboard Actually Does
Signals land → scores update → portfolio filters → CSM alerts. See account risk in real time, then act.
Signals Stream In
Usage, support, payment, and engagement feed continuously from your existing tools
Score & Band Update
Each account gets a live health score and traffic-light band with top drivers visible
Portfolio Filters
CS directors and CSMs slice by owner, renewal window, ARR, or score drop
Alerts Drive Saves
Drops and payment flags route to the right CSM so Monday reviews become action lists
Everything You Need for Health Monitoring That CS Trusts
Portfolio Risk View
One customer health score dashboard shows every account by traffic-light band, ARR at risk, and score trend so your CS director opens Monday with a live book, not a scavenger hunt.
Multi-Signal on One Screen
Usage, support load, payment status, and engagement sit beside the score. CSMs see why an account is amber without opening four other tools.
Filterable Account Lists
Slice by owner, segment, renewal window, band, or score drop. Health monitoring becomes a working queue, not a wall of equal green lights.
CSM Alert Routing
Score drops and payment flags route to the right CSM in Slack or email with the top drivers attached, so account risk triggers save work the same day.
Score Feed Agnostic
Bring scores from rules, your existing CS platform, or AI health scoring. The dashboard is the operational cockpit; the model is just one input.
Save Work from the View
Red and amber rows open into playbook tasks, renewal notes, and CRM updates so the health dashboard ends in action, not another ignored chart.
Platforms We've Wired into Health Dashboards
From 14 Hours of Status Stitching to a 90-Minute Save Queue
How a 6-person CS team at a B2B SaaS company stopped guessing account risk and started seeing it in real time.
The Manual Portfolio Review
- Each CSM spent Monday morning in product analytics, Zendesk, billing, and a shared sheet
- Traffic lights in the CRM lagged by a week and ignored payment delinquency
- At-risk logos surfaced in renewal calls, not in a filterable red/amber list
- Save rate on flagged accounts sat around 18%, in line with late-detection benchmarks
- Directors had no single view of ARR sitting in red or amber bands
The Live Health Score Dashboard
- Portfolio opens on traffic-light bands with usage, support, payment, and engagement beside each score
- Score drops and failed payments alert the owning CSM the same day
- Monday reviews start from a filterable at-risk list, not five browser tabs
- Save rate on early-flagged accounts moved to 42%, matching Gainsight early-detection ranges
- AI health scores feed the view where useful; the sell is the operational cockpit, not the model
Before vs After the Health Dashboard
How It Works
From first conversation to a live health score dashboard in 3–5 weeks.
Tell Us Your Setup
Which CRM, where usage, support, and billing live, and how CS currently judges account risk.
Free Scoping Call
30-minute call with your CS director to define bands, filters, alert rules, and the Monday review workflow.
Build & Test
We wire the dashboard, feed in your scores and signals, and shadow a full portfolio week before go-live.
Go Live & Monitor
CS runs from the live health view. We tune alerts, bands, and filters as save work and retention move.
Frequently Asked Questions
How is a health score dashboard different from AI customer health scoring?
AI scoring builds the continuous 0–100 signal from usage, support, and engagement. The customer health score dashboard is the CS team's operational cockpit: portfolio risk view, traffic-light bands, filterable lists, and alert routing so those scores (AI or otherwise) become Monday save work. Many clients run both; we often feed AI scores into the dashboard.
What signals appear on the health dashboard?
Typical views combine product usage and seat utilisation, support ticket volume and severity, payment and delinquency status, and engagement (meetings, email replies, QBR attendance). You see the composite customer health score plus the drivers that explain the band, so CSMs know what to fix.
Will this replace Gainsight, ChurnZero, or our CRM reports?
It can sit on top of them or replace a brittle spreadsheet stack. If you already have scores in a CS platform or CRM, we surface them in a purpose-built health monitoring view with the filters, alerts, and portfolio risk layout your directors actually use each week.
How much CSM time does a live dashboard free up?
Manual health assembly commonly consumes 12–15 hours per week per CSM gathering status across tools (Gainsight benchmarks). A live dashboard typically cuts that to under 90 minutes of review, so capacity goes into save plays instead of status stitching.
How long does a customer health score dashboard take to set up?
Most builds take 3–5 weeks from scoping to go-live: signal audit, score feed, portfolio view, alert routing, and a parallel week with your CS team. Cleaner HubSpot or Salesforce books with clear usage and billing data can be live in about two weeks.
How much does a health score dashboard cost?
Purpose-built health dashboards with multi-signal feeds and CSM alert routing typically range from R35,000 to R75,000 depending on data sources and complexity. Teams with meaningful ARR at risk usually recover the project cost within 2–4 months from retained revenue and CSM hours alone.
Stop Running Monday Reviews Blind
If your CS team still assembles account status from five tools and gut feel, you are spending the early-warning window on data entry instead of saves.
Tell us which CRM you run, where usage, support, and billing live, and how portfolio reviews work today. We will show you what a customer health score dashboard would look like for your book.