Error Monitoring for No-Code Automations: Catch Silent Failures Before They Corrupt Your Data
Your Zapier, Make, and n8n flows move deals, invoices, and stock every day. When they fail silently, CRM and accounting drift for days before anyone notices, and the clean-up costs more than the automation ever saved.
We build the monitoring dashboards and failure alerts that make those breaks impossible to miss.
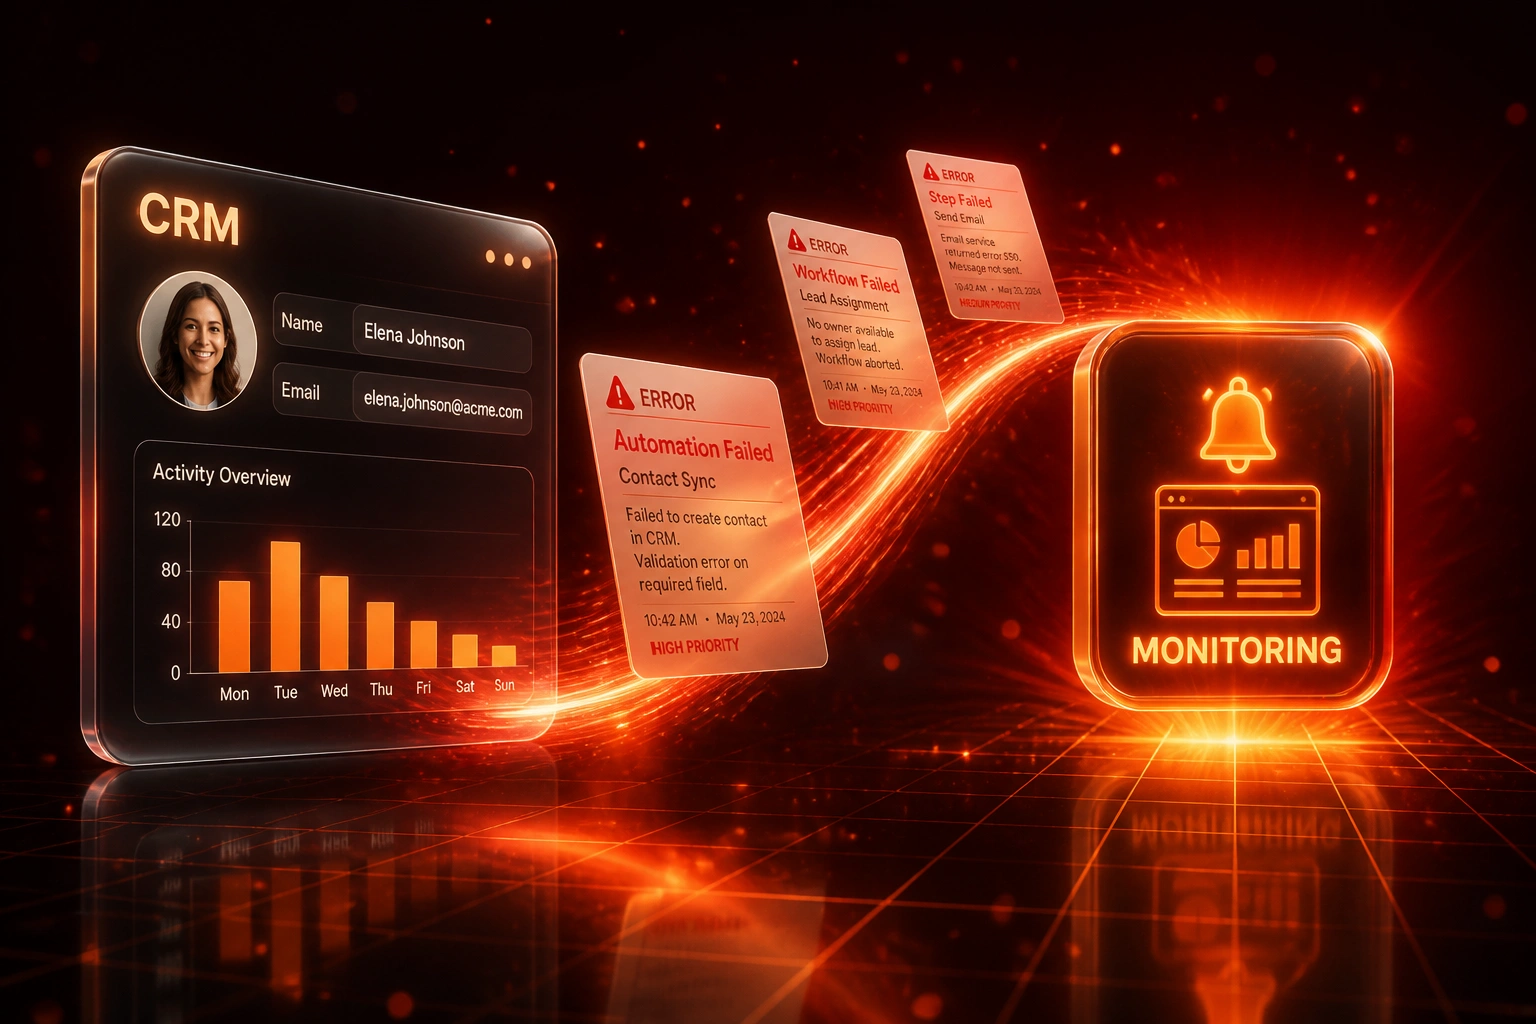
Sound Familiar?
These are the exact issues our clients faced before they had real automation error monitoring:
- A Zapier zap or Make scenario stops firing and nobody notices until a customer complains
- CRM and accounting look fine on the surface while records silently fail to sync
- Error emails pile up unread while a vendor API change breaks half the workflow
- Finance discovers stale invoices and mismatched balances days into month-end
- There is no single dashboard showing which automations are healthy right now
A vendor API change or expired OAuth token can break zaps without a clear alarm, and Zapier error emails are easy to ignore until month-end. By then, CRM and accounting may already disagree by hundreds of records.
What Error Monitoring Actually Does
Failure happens → alert fires → payload is quarantined → ops fixes and replays. No more silent data corruption.
Automation Runs or Stops
Zapier, Make, or n8n executes, pauses, or goes quiet after an API or auth change
Health Check Detects It
Heartbeat, error route, or volume anomaly flags the break within minutes
Alert Hits Ops
Slack, WhatsApp, or email with workflow name, last success, and failed payload context
Quarantine & Recover
Dead-letter queue holds the record until it is fixed and safely replayed
Everything You Need for Reliable Failure Alerts
Live Monitoring Dashboards
One view of every critical Zapier, Make, and n8n workflow: last successful run, failure rate, and lag against expected volume.
Immediate Failure Alerts
Slack, WhatsApp, or email the moment a workflow errors, pauses, or goes quiet. No more relying on ignored Zapier inboxes.
Heartbeat Health Checks
Expected-schedule pings catch silent stops: expired OAuth, quota limits, and filters that swallow every record without an error.
Dead-Letter Queues
Failed payloads land in a quarantine queue with full context, so your team can replay or fix them instead of losing the data.
Record-Level Reconciliation
Nightly checks compare CRM, payment, and accounting counts so partial batch failures surface even when the platform shows green.
Escalation & Runbooks
Severity rules, on-call routing, and short playbooks so ops knows who acts, how, and within what SLA when an alert fires.
Platforms We Monitor Around
From 11 Days Blind to Under One Hour
How a 35-person wholesale distributor stopped silent Zap failures from corrupting CRM and Xero for days at a time.
The Silent Failure
- Forty-plus Zapier and Make flows synced HubSpot deals into Xero invoices
- An OAuth token expired; several zaps kept "succeeding" with empty updates
- Finance only noticed when month-end balances would not reconcile
- Eleven days of drift: 340 customer and invoice records out of date
- Ops spent a full week reconstructing what should have synced automatically
The Monitored Process
- Heartbeat checks on every money-moving workflow, plus Slack failure alerts
- Dead-letter queue holds bad payloads with enough context to replay safely
- Nightly CRM-to-Xero count reconciliation flags partial batch misses
- Critical breaks surface in minutes, not at month-end
- Ops lead reviews a weekly health digest instead of firefighting in the dark
Before vs After Error Monitoring
How It Works
From first conversation to live failure alerts in 2–4 weeks.
Map Critical Flows
We inventory the automations that move money, customers, or stock, and rank them by blast radius if they fail silently.
Free Scoping Call
30-minute call to design dashboards, alert channels, health-check intervals, and dead-letter handling for your stack.
Build & Instrument
We wire monitoring, heartbeats, and queues around your existing Zapier, Make, or n8n flows without rewriting them overnight.
Go Live & Tune
Alerts go live, false positives are trimmed, and your ops lead gets a weekly health digest plus on-call escalation.
Frequently Asked Questions
Do we need to replace Zapier, Make, or n8n to get proper error monitoring?
No. We build monitoring, alerting, health checks, and dead-letter queues around the automations you already run. The goal is visibility and fast recovery, not a rip-and-replace of tools your team knows.
How is this different from Zapier error emails or Make scenario history?
Native alerts cover loud execution failures, and even then they are easy to ignore. They do not catch paused zaps, filtered-empty runs, quota stops, or workflows that succeed while skipping 2–5% of records. Our layer watches for silence, lag, and reconciliation gaps, not just red error statuses.
How quickly will we know when something breaks?
Industry research puts mean detection at about 4.2 days without independent monitoring, versus roughly 47 minutes with it. Our clients typically see critical-path alerts within minutes, and heartbeat failures within one expected run window.
Will this disrupt our current automations?
No. Instrumentation sits alongside your flows. We add health pings, alert routes, and quarantine queues without changing how sales or finance use HubSpot, Xero, or the rest of the stack. Parallel observation comes first; process changes only after you trust the signals.
What happens to failed records once they are caught?
They land in a dead-letter queue with the payload, timestamp, and workflow name. Your team can fix the root cause, replay the record, or escalate. Nothing is silently dropped, and nothing is blindly retried into a broken destination.
How much does automation error monitoring cost?
Focused health checks and alerting for a handful of critical flows start from around R15,000. Full dashboards, dead-letter queues, reconciliation, and escalation for a larger Zapier/Make/n8n estate typically run R25,000 to R55,000. Most ops teams recover that cost within one avoided silent-failure incident.
Stop Letting Silent Automation Errors Corrupt Your Data
If your ops or finance lead only learns about broken syncs when a customer or month-end close complains, you are paying for a problem that monitoring already solves.
Tell us which Zapier, Make, or n8n flows move money and customers, and where failures would hurt most. We will show you the dashboard, alert routes, and dead-letter design that fit your stack.