Financial Reporting Dashboard: Stop Waiting for Month-End Packs
You wait until day 10 or 12 for the Excel pack, then discover a margin slide that started in week one. By then pricing, hiring, and vendor decisions have already run on stale data. A live financial dashboard shows revenue, expenses, and margins while you can still act.
We build the financial analytics view that replaces the month-end waiting room.
Sound Familiar?
These are the exact issues our clients faced before a live financial dashboard:
- Month-end Excel packs arrive on day 12, and by then margin problems are already three weeks old
- Finance spends 20–50 hours a month reconciling cash across bank, ledger, and CRM exports
- Revenue in the CRM, expenses in Xero or Sage, and bank balances never sit on one P&L view
- Board packs are rebuilt by hand every period, then disputed because two spreadsheets disagree
- Pricing, hiring, and vendor decisions run on last month's numbers while the market has already moved
Remote boards and IFRS / SA GAAP pack pressure are rising while finance labour in South Africa costs around R269 per hour. Assembling a 40-hour month-end pack already burns roughly R10,800 a month before you count the commercial cost of deciding on stale margins.
What the Financial Dashboard Actually Does
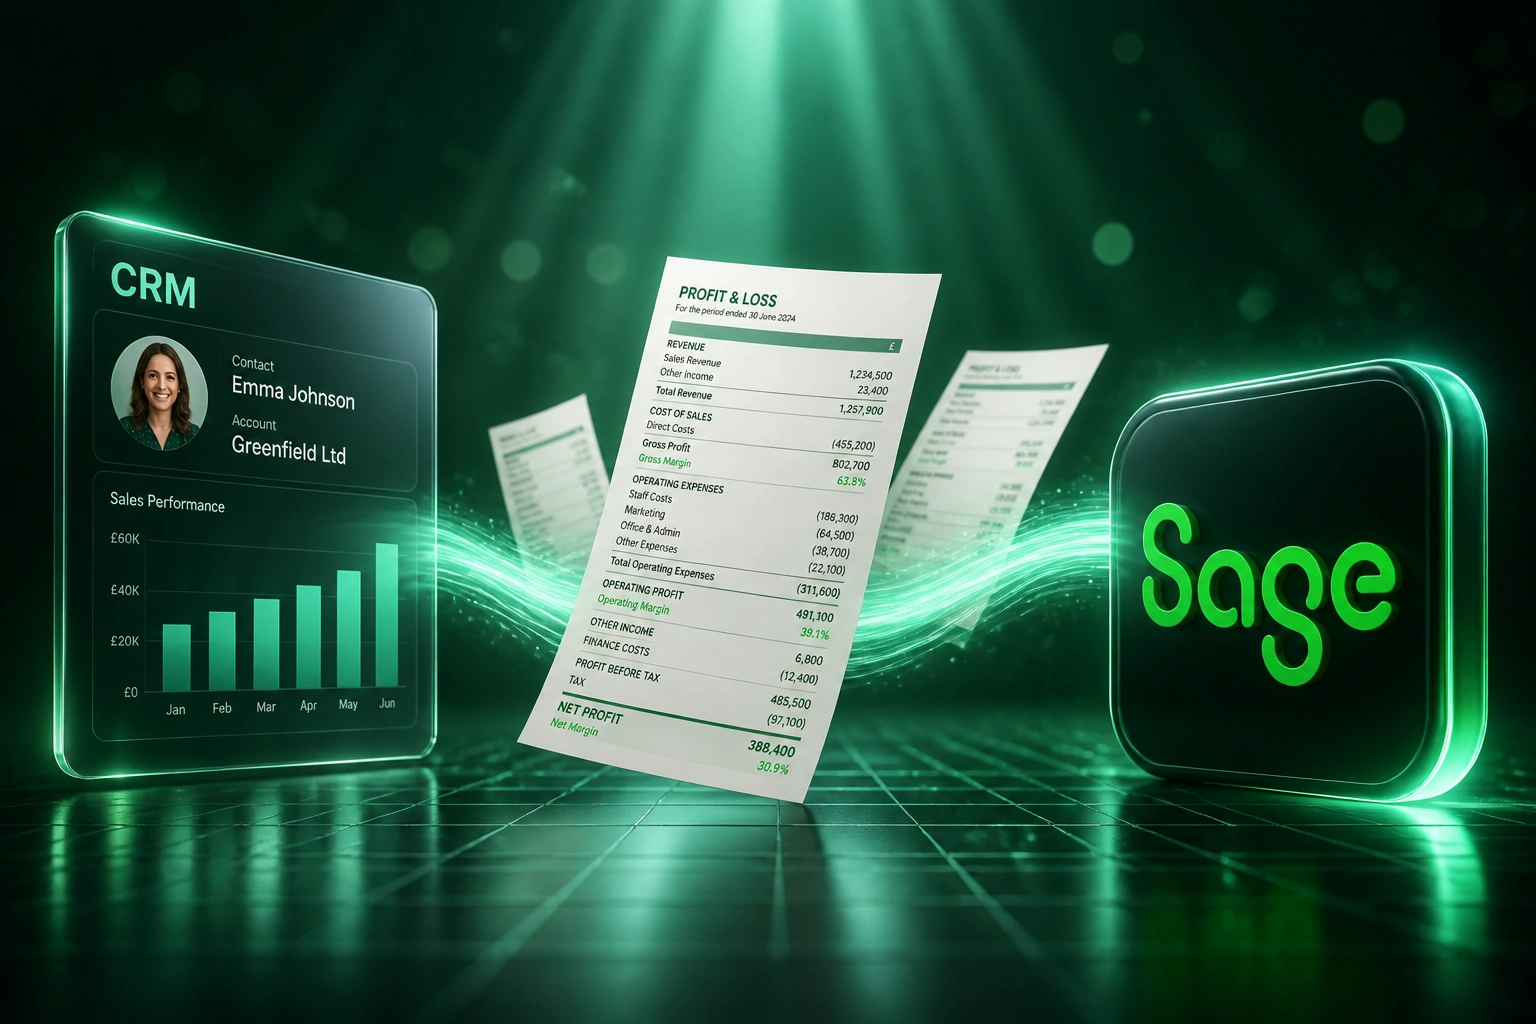
Ledger, bank, and CRM feed one live P&L. Leadership opens revenue, expenses, and margins daily, not on day 12.
Sources Stay Live
Xero, Sage, or QuickBooks, bank feeds, and CRM bookings update on a schedule you trust
P&L Assembles Itself
Revenue, expenses, and margin lines map into one governed financial analytics model
Leadership Opens Daily
CEO and CFO see the same numbers on desktop or phone, without waiting for finance exports
Act While It Matters
Margin alerts and board packs export from the live view, not from a fragile spreadsheet chain
Everything You Need for Live Financial Analytics
Live P&L View
Revenue, expenses, and margins refresh daily from accounting, bank feeds, and CRM bookings so leadership stops waiting for the month-end pack.
Cross-Source Financial Analytics
Xero, Sage, or QuickBooks joins bank activity and CRM revenue in one governed model. Native accounting reports stay single-system; the dashboard does not.
Margin Drift Alerts
Threshold alerts when gross or operating margin moves outside the band you set, so you act in week two instead of discovering it in week six.
Board-Ready Revenue Reporting
Scheduled packs export from the same live financial dashboard the CFO already trusts, ending the Friday ritual of screenshots and formula glue.
Expense & Cost Centre Slice
Department and project cost centres from the ledger sit beside revenue so contribution margin is visible without a second spreadsheet rebuild.
Role-Based Access
CEO and CFO see the full P&L. Ops and sales get the slices they need, without exporting sensitive ledger detail into shared drives.
Systems We've Connected into Financial Dashboards
From Day-12 Packs to Daily Margins
How a Cape Town manufacturer stopped discovering margin problems three weeks late and cut pack assembly from 40 hours to 6.
The Month-End Ritual
- Finance exported Xero, bank CSVs, and CRM revenue into a master Excel pack
- 40 hours a month assembling, reconciling, and fixing broken VLOOKUPs
- P&L landed around day 12; pricing and vendor decisions already locked in
- A 4-point gross margin slide was found only after the pack was finalised
- Board disputed numbers because two spreadsheet versions disagreed
The Live Financial Dashboard
- Xero, bank feeds, and CRM bookings refresh into one P&L every morning
- Finance reviews exceptions for about 6 hours a month instead of rebuilding packs
- CEO and CFO open revenue, expenses, and margins on Monday without waiting
- Margin alerts fired in week two when contribution slipped again
- Board packs export from the same live view leadership already trusts
Before vs After a Live Financial Dashboard
How It Works
From first conversation to a live financial reporting dashboard in 3–6 weeks.
Tell Us Your Close Ritual
Which ledger, which CRM, how long the month-end pack takes, and which margin questions still wait until day 12.
Free Scoping Call
30-minute call to map P&L lines, data sources, and whether this is a dashboard build, an integration layer, or both.
Build & Parallel-Run
We connect accounting, bank, and CRM APIs, build the live financial reporting dashboard, and run it beside your Excel pack for two weeks.
Go Live & Retire the Pack
Switch leadership to the live view. Monitoring keeps the sync healthy so the numbers stay trusted every morning.
Frequently Asked Questions
How is a live financial reporting dashboard different from month-end accounting close?
The close still produces statutory books. The dashboard is operational: revenue, expenses, and margins refreshed daily from Xero, Sage, or QuickBooks plus bank and CRM, so the CEO and CFO can act while the numbers are still actionable. You keep the close; you stop making every commercial decision wait for it.
Why not just use the built-in Xero, Sage, or QuickBooks reports?
Native reports are excellent for single-system accounting views. They do not join CRM bookings, bank reality, and ledger P&L into one live financial analytics view, and multi-entity consolidation usually still falls back to Excel. That is the wall our clients hit when they need a real financial dashboard, not another export.
How is this different from an executive KPI dashboard or invoice tracking?
An executive KPI dashboard is a handful of board metrics across sales, cash, and delivery. Invoice tracking watches paid, pending, and overdue status. This page is the live P&L: revenue reporting, expense burn, and margin in real time so you stop discovering margin slides weeks late in a month-end pack.
Which systems can feed the financial dashboard?
We typically pull the ledger from Xero, Sage, or QuickBooks, cash from bank feeds or statement extracts, and bookings or pipeline revenue from HubSpot, Pipedrive, Salesforce, or Zoho CRM. The front end can be Power BI, Looker Studio, or a tailored app, depending on how your leadership prefers to work.
How long does a financial reporting dashboard take to build?
Most mid-market builds take 3–6 weeks from scoping to go-live, including two weeks of parallel running against your existing month-end pack. A focused single-entity P&L with one ledger and one CRM can be live sooner. Multi-entity or multi-currency groups sit closer to 6–8 weeks.
How much does a live financial reporting dashboard cost?
Focused live P&L dashboards typically start from around R45,000. Broader builds with cost-centre slices, margin alerts, and scheduled board packs usually fall between R60,000 and R95,000. Teams spending 30+ hours a month assembling Excel packs usually recover the build cost within one or two quarters from finance time alone, before counting faster margin decisions.
Stop Steering on Last Month's Pack
If your CEO and CFO still wait for an Excel P&L before they can trust revenue, expenses, and margins, you are paying for delayed decisions with both labour and opportunity.
Tell us which ledger you run, which CRM owns bookings, and how long month-end packs take today. We will show you exactly how a live financial reporting dashboard would work for your business.