Multi-Project Portfolio Dashboard: See the Whole Book at a Glance
Every Monday the MD opens five tools, or five spreadsheets, to learn whether the portfolio is healthy. Budget burn, timeline risk, and resource utilisation never sit in the same place, so decisions wait on a pack that is already out of date.
We build the live project portfolio dashboard that puts health, budget, timeline, and utilisation in one view.
Sound Familiar?
These are the exact issues our clients faced before a live portfolio view:
- The MD opens Asana, Jira, Monday, a budget spreadsheet, and a capacity sheet every Monday just to ask whether the portfolio is healthy
- Budget burn and timeline risk arrive as three different stories depending on who built the pack
- Resource utilisation is only visible after someone rebuilds a capacity grid by hand
- By the time the multi-project overview lands, a red project has already slipped another week
- Leadership debates last week's snapshot instead of acting on live portfolio health
Tempo's 2026 State of SPM found only 37% of organisations have good or complete portfolio visibility, rising to 82% where portfolio processes are fully integrated. Late visibility is not a reporting inconvenience. It is how underperforming projects keep burning budget while leadership still thinks the book is green.
What the Portfolio Dashboard Actually Does
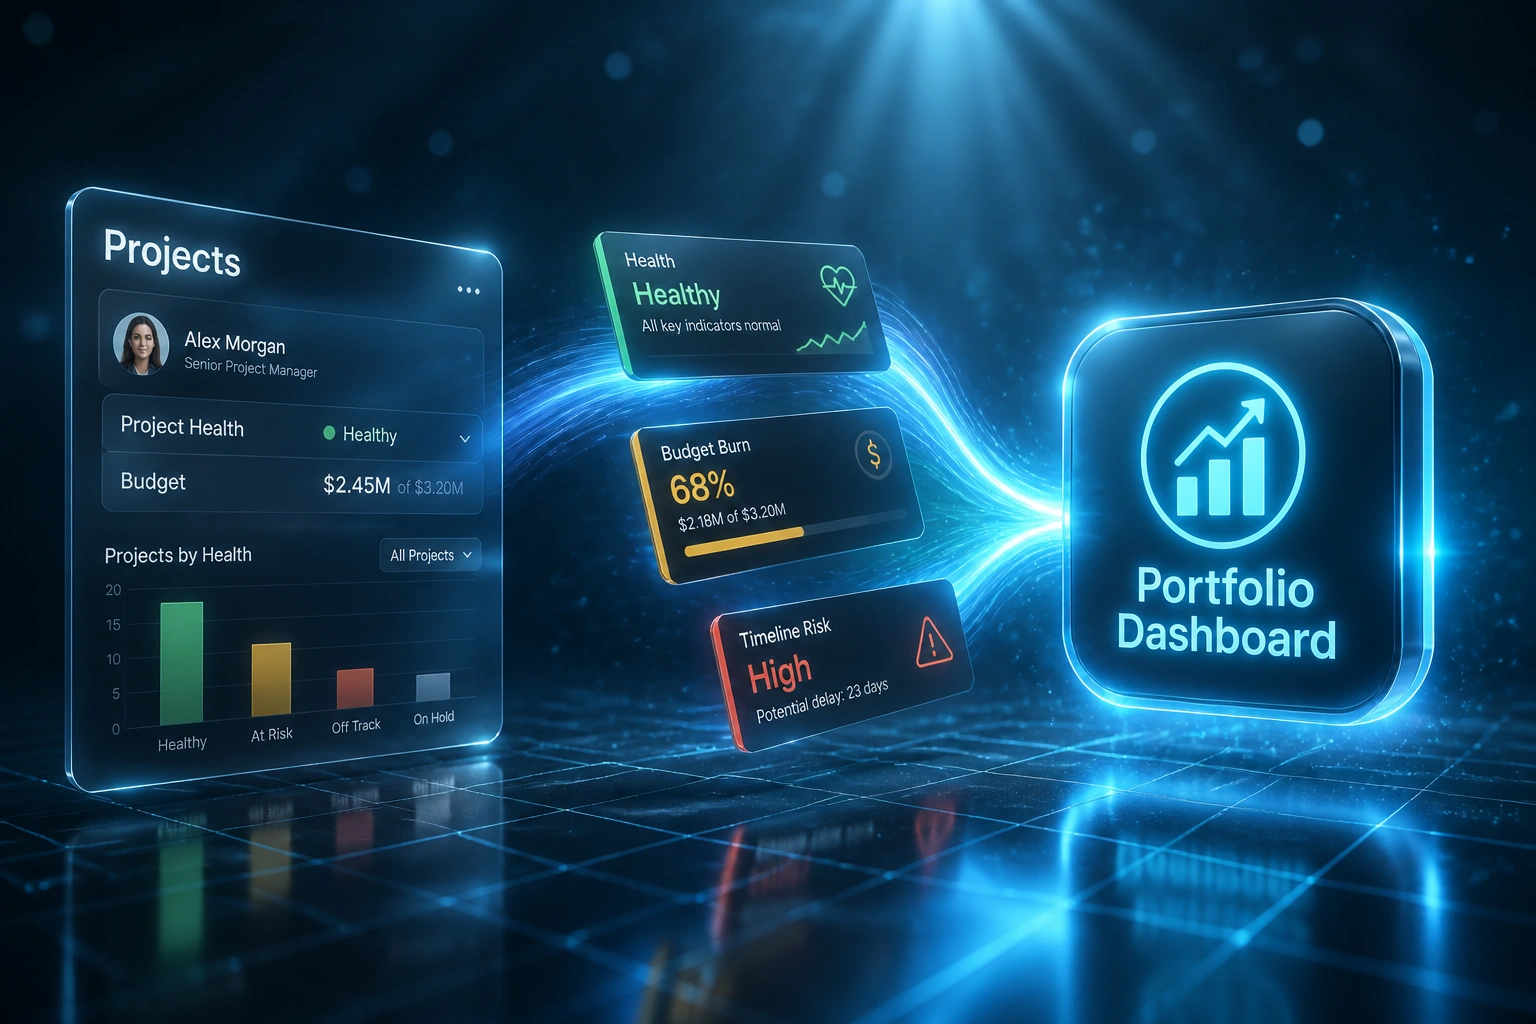
Live project tools → health, budget, timeline, utilisation → one executive multi-project overview.
Tools Stay Current
Teams keep updating Asana, Jira, Monday, capacity, and finance as they already do
Signals Roll Up
Health, budget burn, timeline risk, and utilisation aggregate into one portfolio view
Exceptions Surface
Amber and red projects, overruns, and over-allocation flag for leadership review
Monday Is Instant
The MD opens one multi-project overview instead of five tools and three spreadsheets
Everything You Need for Portfolio Management Visibility
Live Portfolio Health View
Every active project surfaces RAG health, owner, and status in one multi-project overview so executives stop stitching boards by hand.
Budget Burn Tracking
Approved budget, actuals, and forecast burn pull from project and finance sources into one portfolio management view with variance flags.
Timeline and Milestone Risk
Slippage, overdue milestones, and critical-path risk roll up across the portfolio so timeline problems show before the next board pack.
Resource Utilisation Roll-Up
Capacity, allocation, and bench time across Float, Resource Guru, Monday Workload, or Asana Workload appear beside project demand.
Multi-Tool Project Feed
Asana, Jira, Monday.com, ClickUp, and related tools feed one project portfolio dashboard. No more five-tab Monday mornings.
Exception Alerts for Leadership
Amber and red projects, budget overruns, and over-allocated people trigger alerts so the MD reviews exceptions, not the whole book.
Platforms We've Connected into Portfolio Dashboards
From Five Tools on Monday to One Live View
How a 45-person professional services firm gave its MD a multi-project overview of health, budget burn, and utilisation across 22 active projects.
The Manual Portfolio Ritual
- MD opened Asana, Monday, a Jira board, a budget sheet, and a capacity grid every Monday
- Ops spent 8–10 hours a week chasing updates and rebuilding the multi-project overview
- Budget burn and timeline risk disagreed depending on who compiled the pack
- Two red projects stayed amber on paper for three weeks because the pack lagged
- Resource utilisation only appeared after a late-Sunday spreadsheet rebuild
The Live Portfolio Dashboard
- One project portfolio dashboard shows health, budget burn, timeline risk, and utilisation
- MD opens the view in under two minutes; ops reviews exceptions instead of rebuilding slides
- Amber and red projects flag the same day the source board changes
- Capacity conflicts appear beside demand before people are double-booked
- Board packs become a print of the live view, not a four-day production job
Before vs After a Portfolio Dashboard
How It Works
From first conversation to live portfolio dashboard in 2–6 weeks.
Tell Us Your Setup
Which project tools you run, how budget and capacity are tracked today, and what the MD needs on Monday morning.
Free Scoping Call
30-minute call to map health, budget, timeline, and utilisation sources into one portfolio dashboard design.
Build & Test
We wire the live feeds, run the dashboard in parallel with your current Monday pack for two cycles, and tune the risk thresholds.
Go Live & Monitor
Switch off the five-tool scramble. Monitoring catches stale boards and feed failures before leadership notices.
Frequently Asked Questions
How long does a multi-project portfolio dashboard take to set up?
A standard portfolio dashboard from one or two project tools takes 2–4 weeks from scoping to go-live. Multi-tool setups that also pull budget burn and resource utilisation typically take 4–6 weeks, including two parallel Monday reviews so directors can compare the live view to the old pack.
Which tools can feed a project portfolio dashboard?
We have built portfolio feeds from Asana, Jira, Monday.com, ClickUp, and Linear, with capacity from Float, Resource Guru, Monday Workload, and Asana Workload. Budget actuals can come from Xero, Sage, or your finance export. The dashboard can live in Power BI, Looker Studio, or a custom web view. If your tool has an API, we can connect it.
How is this different from automated status reporting packs?
Status reporting automation produces a scheduled client or exec pack for one project or account. A multi-project portfolio dashboard is the leadership view across every active project at once: health, budget burn, timeline risk, and resource utilisation in a single screen. Many firms need both. The portfolio view answers "is the book healthy?" before anyone opens a status pack.
Will this disrupt how project directors already work?
No. Teams keep updating Asana, Jira, or Monday as they do today. The portfolio dashboard reads that live data. Directors still own delivery; executives finally see the book without a Monday rebuild. We run parallel for two cycles before switching off the manual collation.
Can we show budget and utilisation next to project health?
Yes. That is the point of portfolio management visibility. We map health and timeline from project tools, burn from finance or timesheets, and utilisation from your capacity tool so leadership sees one coherent multi-project overview instead of four conflicting spreadsheets.
How much does a multi-project portfolio dashboard cost?
Simple health-and-status roll-ups from a single project tool start from around R15,000. Full portfolio dashboards with budget burn, timeline risk, utilisation, and exception alerts typically range from R25,000 to R60,000. Firms recovering a full day of ops and director time every week often see payback within two to three months.
Stop Opening Five Tools Every Monday
If leadership still rebuilds a multi-project overview by hand, you are paying for late visibility on a problem that a project portfolio dashboard already solves.
Tell us which project tools you run, how budget and capacity are tracked today, and what the MD needs to see first. We will show you exactly how a live portfolio management view would work for your book.