Retention Metrics Dashboard: Track What Matters for SA Businesses
Your CEO and CFO still open board packs where churn rate, net revenue retention, and customer health were frozen two to four weeks ago. Investors price NRR into the multiple; Excel arrives too late to steer the quarter.
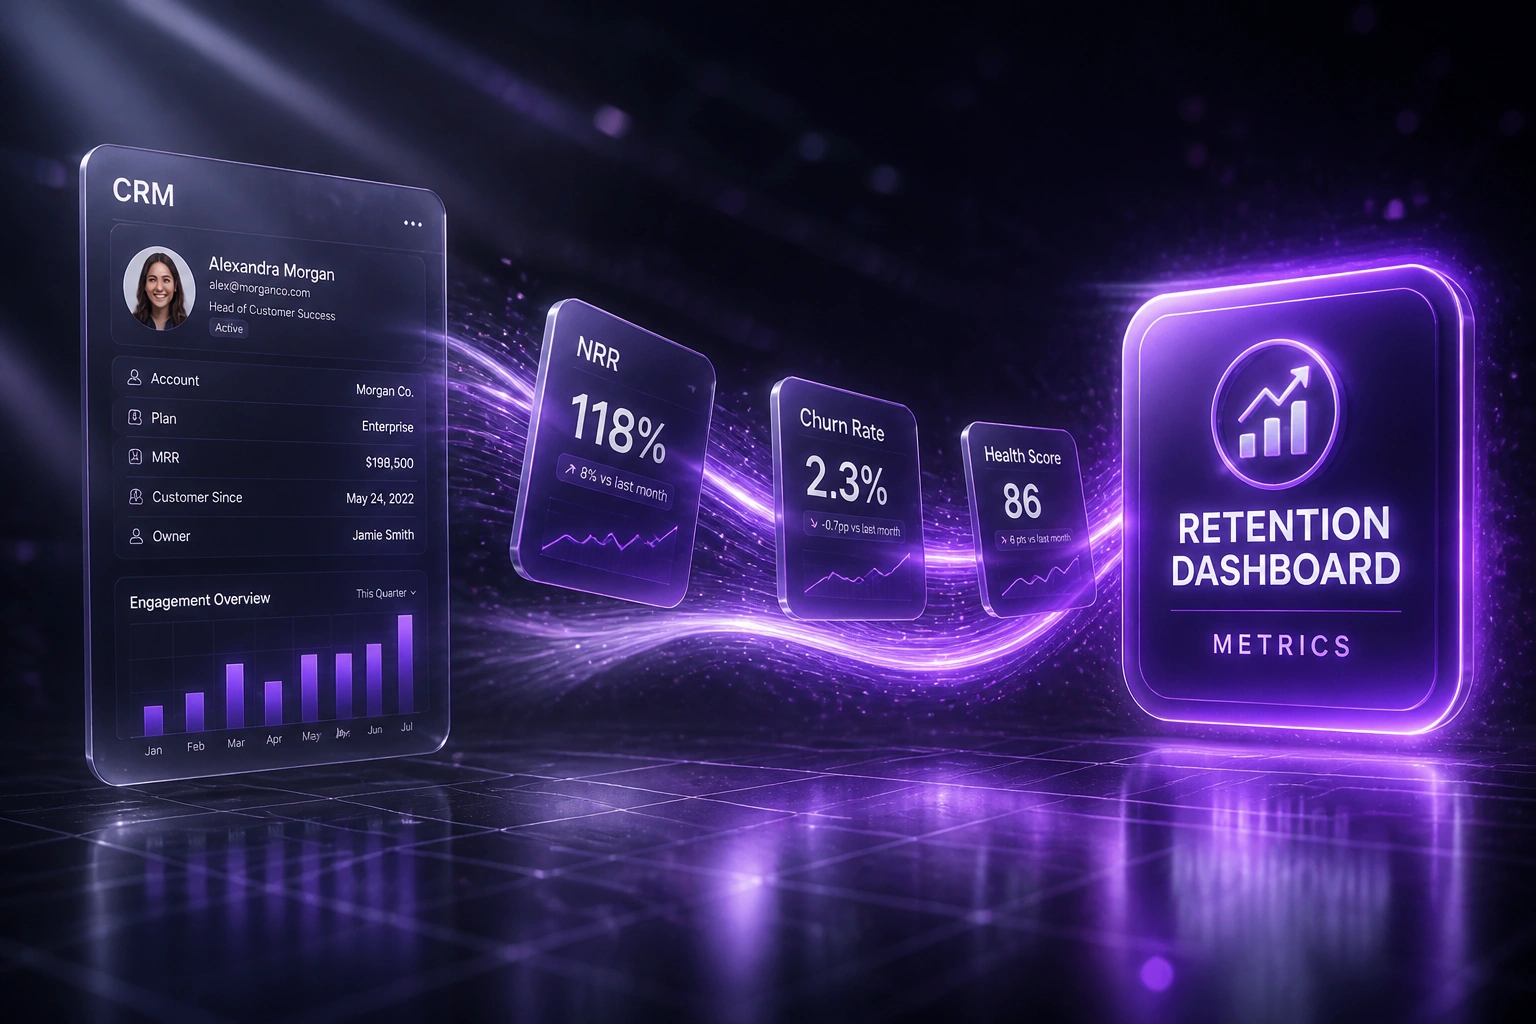
We build the live retention metrics dashboard that joins CRM, billing, and usage into one SA-relevant leadership view.
Sound Familiar?
These are the exact issues our clients faced before a live retention metrics dashboard:
- The board pack's churn and NRR tabs are still Excel exports from last month, so leadership debates stale numbers
- Logo churn, revenue churn, and expansion live in three different tools, so nobody trusts a single Rand figure
- PayFast, Stripe, or Xero subscriptions never join CRM and product usage in one leadership view
- Customer health scores stay with CSMs while the CEO and CFO only see attrition after the cancel arrives
- Investors ask for net revenue retention and GRR, and finance spends a week stitching answers that are already outdated
Investors and boards now price NRR into valuation multiples. Manual Excel packs that lag two to four weeks leave SA CEOs and CFOs steering with outdated churn, expansion, and customer health figures while competitors already run live retention dashboards.
What the Retention Metrics Dashboard Actually Does
CRM updates, billing events, and usage signals land in one leadership view. No late spreadsheet theatre.
Signals Arrive Live
CRM, PayFast or Stripe subscriptions, Xero, and product usage refresh on a shared schedule
KPIs Calculated
Logo churn, revenue churn, NRR, GRR, expansion, and cohort retention use locked definitions
Health Rolls Up
Customer health bands sit beside the Rand metrics so revenue risk and account risk share one screen
Board Pack Ready
CEO and CFO open the same trusted view the scheduled board export uses
Everything You Need for Live Retention Metrics and Customer Health
Executive Retention KPIs
One leadership view for logo churn, revenue churn, NRR, GRR, and expansion revenue in Rand, refreshed from live systems instead of a quarterly spreadsheet ritual.
CRM + Billing Join
HubSpot or Salesforce accounts sit beside PayFast, Stripe, Chargebee, and Xero subscription events so churn and expansion use the same customer keys.
Cohort Retention Curves
See retention by signup month, plan, and segment so the board knows whether early cohorts hold or silently erode after month six.
Customer Health Roll-Up
Portfolio health bands roll into the same dashboard as NRR, so leadership sees revenue risk and account risk together, not in separate CS and finance packs.
Board-Ready Packs
Scheduled Power BI, Looker, or Metabase exports pull the same live metrics the CEO opens mid-week, so the board pack stops lagging two to four weeks.
SA Billing Context
Rand figures, local VAT treatment, and South African billing rails (PayFast, Peach, Xero subscriptions) map cleanly so investors see numbers they recognise.
Platforms We've Wired into Retention Dashboards
From 28 Hours per Board Cycle to 2 Hours of Review
How a Cape Town SaaS company on roughly R8M ARR replaced lagging Excel retention packs with a live leadership dashboard in Rand.
The Manual Process
- Finance exported HubSpot, PayFast subscriptions, and product usage into separate workbooks every board cycle
- NRR and GRR were recalculated in Excel with formulas that drifted between quarters
- Logo churn and revenue churn disagreed because CRM and billing used different customer keys
- Board pack lag averaged three weeks after month-end close
- Customer health stayed in CS tools the CEO never opened before the meeting
The Live Dashboard
- CRM, PayFast, and usage feed one retention metrics dashboard with locked KPI definitions
- CEO and CFO open NRR, churn, expansion, and health mid-week in Rand
- Scheduled Power BI pack uses the same numbers as the live view
- Board pack lag dropped from three weeks to the same week as close
- Finance reviews commentary instead of rebuilding charts from scratch
Before vs After a Retention Metrics Dashboard
How It Works
From first conversation to live retention metrics dashboard in 3–5 weeks.
Tell Us Your Stack
Which CRM, billing rails, and product analytics you run, and which retention metrics the board already demands.
Free Scoping Call
30-minute call with your CEO, CFO, or Head of Growth to define KPI definitions, refresh cadence, and the leadership view.
Build & Reconcile
We join CRM, billing, and usage into the retention metrics dashboard, then reconcile a parallel month against your old Excel pack.
Go Live & Coach
Switch off the late spreadsheet ritual. Leadership gets live NRR, churn, expansion, and health, with a short handoff on how to read the view.
Frequently Asked Questions
How is this different from a customer health score dashboard?
A health score dashboard is the CSM's traffic-light book of account risk. A retention metrics dashboard is the leadership view: logo churn, revenue churn, NRR, GRR, expansion revenue, cohort retention, and health rolled into one board and CEO pack. Many clients run both; health feeds the executive roll-up.
How is this different from churn reporting?
Churn reporting digs into exit patterns and at-risk cohorts so CS can intervene. Retention metrics dashboards answer the board questions: are we above 100% NRR, is expansion covering churn, and how does this month's Rand retention compare to last quarter? Forensic churn analysis and executive KPIs solve different jobs.
Which systems can feed the retention metrics dashboard?
We commonly connect HubSpot, Salesforce, Pipedrive, PayFast, Stripe, Chargebee, Xero, product analytics, and Power BI or Looker. If the tool has an API or reliable export, we can bring the signal into one leadership view with Rand figures.
How long does a retention metrics dashboard take to set up?
A focused CRM-plus-billing retention dashboard typically takes 3–5 weeks from scoping to go-live. Broader builds with cohort curves, health roll-ups, and board pack automation usually land in 5–7 weeks.
Will investors and the board trust the numbers?
Yes, when definitions are locked and reconciled. We document how NRR, GRR, logo churn, and revenue churn are calculated, reconcile against finance for a parallel period, then keep the same definitions in the live view and the scheduled board pack.
How much does a retention metrics dashboard cost?
Purpose-built executive retention dashboards typically range from R35,000 to R75,000 depending on data sources and board pack automation. Teams spending 20–40 hours per board cycle on Excel retention packs usually recover the project cost within one or two quarters from finance time alone, before counting earlier save decisions.
Stop Steering the Board with Stale Churn Spreadsheets
If your leadership team still rebuilds NRR, churn rate, and customer health from Excel every quarter, you are paying senior hours for a problem a live retention metrics dashboard already solves.
Tell us which CRM and billing rails you run in South Africa, which metrics the board already demands, and where the pack currently lags. We will show you exactly how a leadership view would look in Rand.