Team Performance Dashboards: Measure What Matters Across Departments
Your sales, delivery, and support teams each live in a different tool, so you cannot compare deliverables, deadlines, or quality without a week of spreadsheet archaeology. That is not a reporting gap. It is a team performance tracking problem.
We build the department dashboard that puts every team on the same scorecard.
Sound Familiar?
These are the exact issues our clients faced before a shared department dashboard:
- Sales, delivery, finance, and support each keep their own scorecard, and none of the definitions match
- Department heads spend a full day stitching CRM, project, helpdesk, and accounting exports before Monday
- You cannot compare deliverables, deadlines, and quality across teams because each tool measures differently
- Hybrid and remote leads report status in slides that are already stale by the time leadership opens them
- Missed deadlines and quality slips surface in the weekly meeting, not while there is still time to fix them
Hybrid work made proximity-based management obsolete. 61% of remote managers now cite accountability and performance visibility as a top challenge, yet only 36% of organisations have fully moved to outcome-based metrics. Without shared team metrics, distributed departments stay invisible until something breaks.
What the Team Performance Dashboard Actually Does
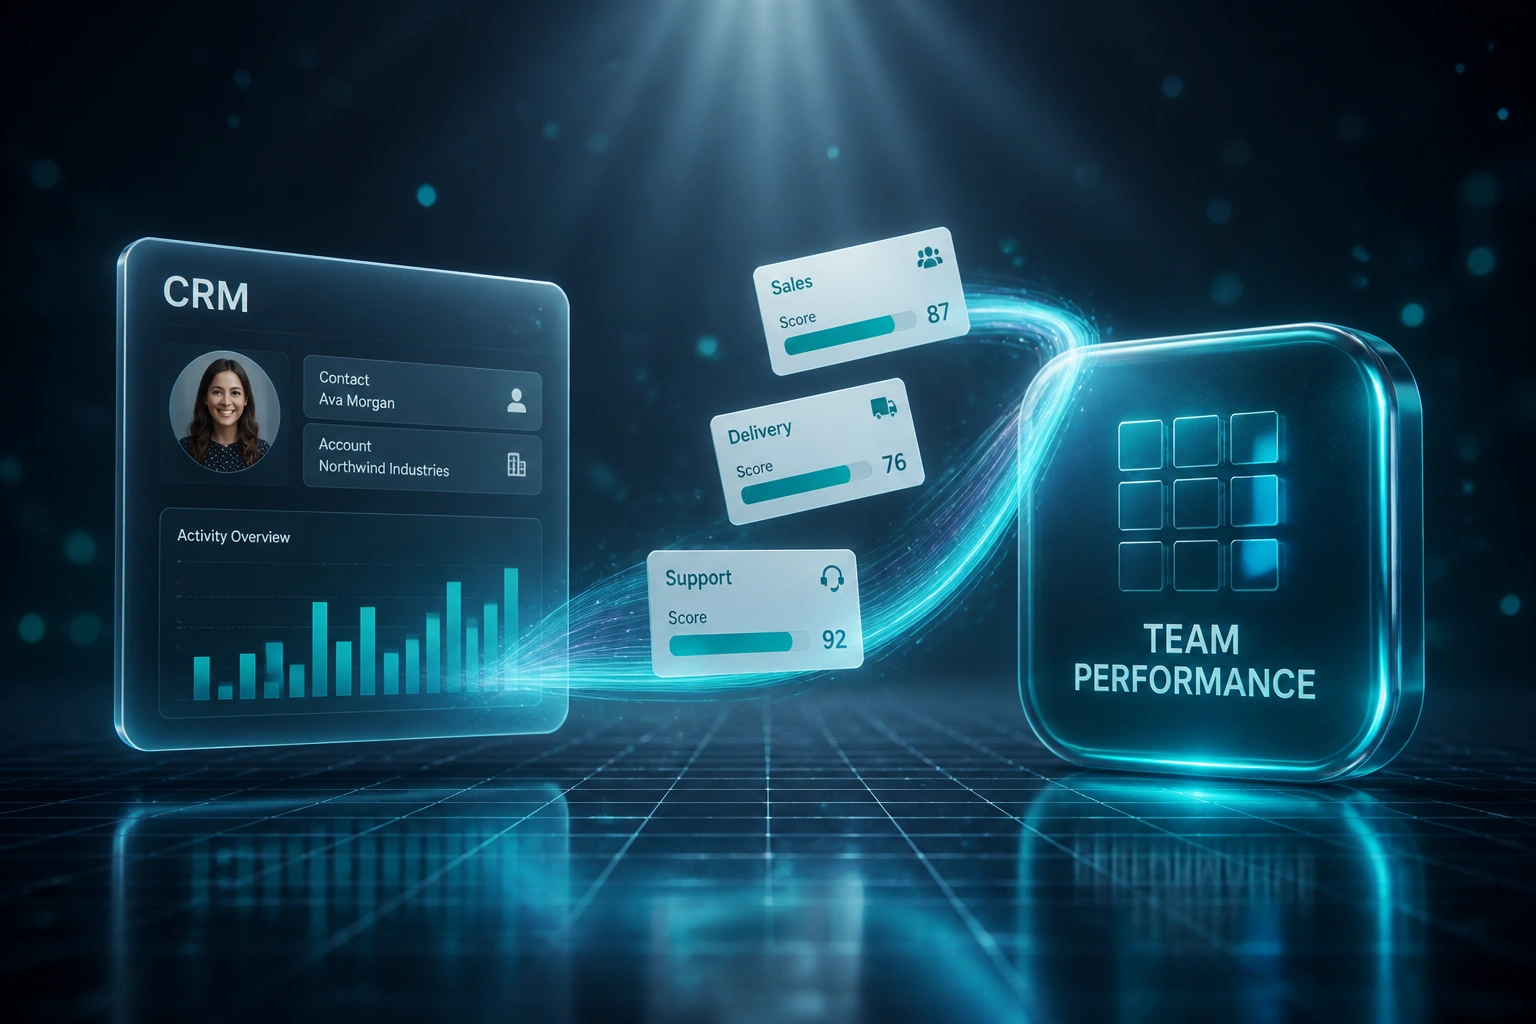
Sources update → scorecards refresh → exceptions alert → leadership compares departments on one screen.
Work Happens in Each Tool
Sales closes deals, delivery ships work, support resolves tickets, finance posts invoices
Metrics Normalise
Deliverables, deadlines, and quality map to shared definitions across every department
Scorecards Refresh
Each department board updates automatically so Monday starts with live team metrics
Leaders Compare Fairly
MD and COO see sales, delivery, finance, and support side by side without chasing exports
Everything You Need for Cross-Department Performance Tracking
Cross-Department Scorecards
Sales, delivery, finance, and support on one team performance tracking dashboard, with deliverables, deadlines, and quality measured the same way everywhere.
Shared Metric Definitions
Agree once what on-time, quality, and throughput mean, then apply those definitions across every department so Friday arguments about the numbers stop.
Live System Feeds
CRM, project tools, helpdesk, and accounting refresh the department dashboard automatically. Managers review exceptions, not rebuild spreadsheets.
Deadline & Quality Alerts
Overdue deliverables, SLA breaches, and quality dips notify the right department head the same day, not at the next status meeting.
Role-Based Team Views
Department heads see their own scorecard. The MD and COO see every team side by side without chasing four different exports.
Scheduled Digests
Monday packs and monthly reviews export from the same live team metrics board, so slides stop drifting from operational reality.
Tools We've Connected for Department Scorecards
From 11 Hours/Week Each to Under 1 Hour
How a 48-person Gauteng services firm put sales, delivery, finance, and support on one team performance tracking dashboard.
The Manual Process
- Four department heads exported from HubSpot, Asana, Zendesk, and Xero every Friday
- 11 hours each assembling scorecards with mismatched definitions of on-time and quality
- Cross-department comparison took 3 to 4 business days and still sparked definition fights
- Hybrid leads filed status in slides that were stale by Monday's ops call
- Missed deadlines only surfaced in the weekly meeting, after the damage was done
The Automated Process
- CRM, project, helpdesk, and accounting feed one Power BI team metrics board
- Shared metric contract for deliverables, deadlines, and quality across all four teams
- Department heads review live scorecards in under an hour a week
- MD and COO compare teams side by side on Monday morning without chasing exports
- Overdue and quality alerts fire the same day, while there is still time to intervene
Before vs After Team Performance Tracking
How It Works
From first conversation to live department scorecards in 3 to 5 weeks.
Map Department Metrics
Which deliverables, deadlines, and quality measures each department head already tracks, and which tools own those numbers today.
Agree the Scorecard Contract
Lock shared definitions for on-time, quality, and throughput so sales, delivery, finance, and support compare like with like.
Build and Parallel-Run
Connect CRM, project, helpdesk, and accounting feeds. Run alongside the weekly pack until every department trusts the numbers.
Go Live and Retire the Spreadsheet Ritual
Hand over live department views, schedule digests, and switch off the Monday export-and-paste cycle.
Frequently Asked Questions
How is a team performance dashboard different from an executive KPI dashboard?
An executive KPI dashboard is board-level: revenue, cash, pipeline, and a handful of company health metrics for the CEO. A team performance tracking dashboard is department-level: deliverables, deadlines, and quality scorecards for sales, delivery, finance, and support that the MD, COO, and department heads use every week. We build both; this page is about cross-department team metrics.
Which systems can feed the department scorecards?
We typically connect CRM (HubSpot, Salesforce, Pipedrive), project tools (Asana, Jira, Monday.com), helpdesk (Zendesk, Freshdesk), and accounting (Xero, Sage), then present the view in Power BI, Looker, or Metabase. If a tool has an API, we can include it.
Will each department still keep its own tools?
Yes. Teams keep working in the CRM, project board, and helpdesk they already use. The dashboard reads from those systems and applies shared definitions. We run parallel testing before you retire the spreadsheet consolidation.
How do you stop departments arguing about definitions?
During scoping we write a metric contract: what counts as on-time, what quality means for each team, and how throughput is calculated. Those rules live in the dashboard, not in someone's memory or a fragile spreadsheet formula.
How long does a team performance tracking dashboard take to build?
A focused four-department scorecard across three to four source systems typically takes 3 to 5 weeks from scoping to go-live. Broader multi-team packs with custom quality models and alerting usually sit closer to 5 to 8 weeks.
How much does a team performance dashboard cost in South Africa?
Focused cross-department scorecards start from around R45,000. Multi-source builds with alerting, role views, and scheduled digests typically range from R75,000 to R140,000. Teams recovering 30+ manager hours a week usually see payback inside one or two quarters from hours alone.
Stop Comparing Departments That Live in Different Tools
If your MD and department heads still rebuild scorecards every week because sales, delivery, and support cannot share metrics, you are paying for a problem that already has a solution.
Tell us which departments you need on the board, which tools they use today, and which deliverables, deadlines, and quality measures matter. We will show you exactly how a team performance tracking dashboard would work for your business.